
Spot any issue that impacts important business KPIs and accelerate MTTR by combining all the related data in intuitive visuals. Complete context to solve problems faster.
Vendor
Splunk, a CISCO company
Company Website
How it works
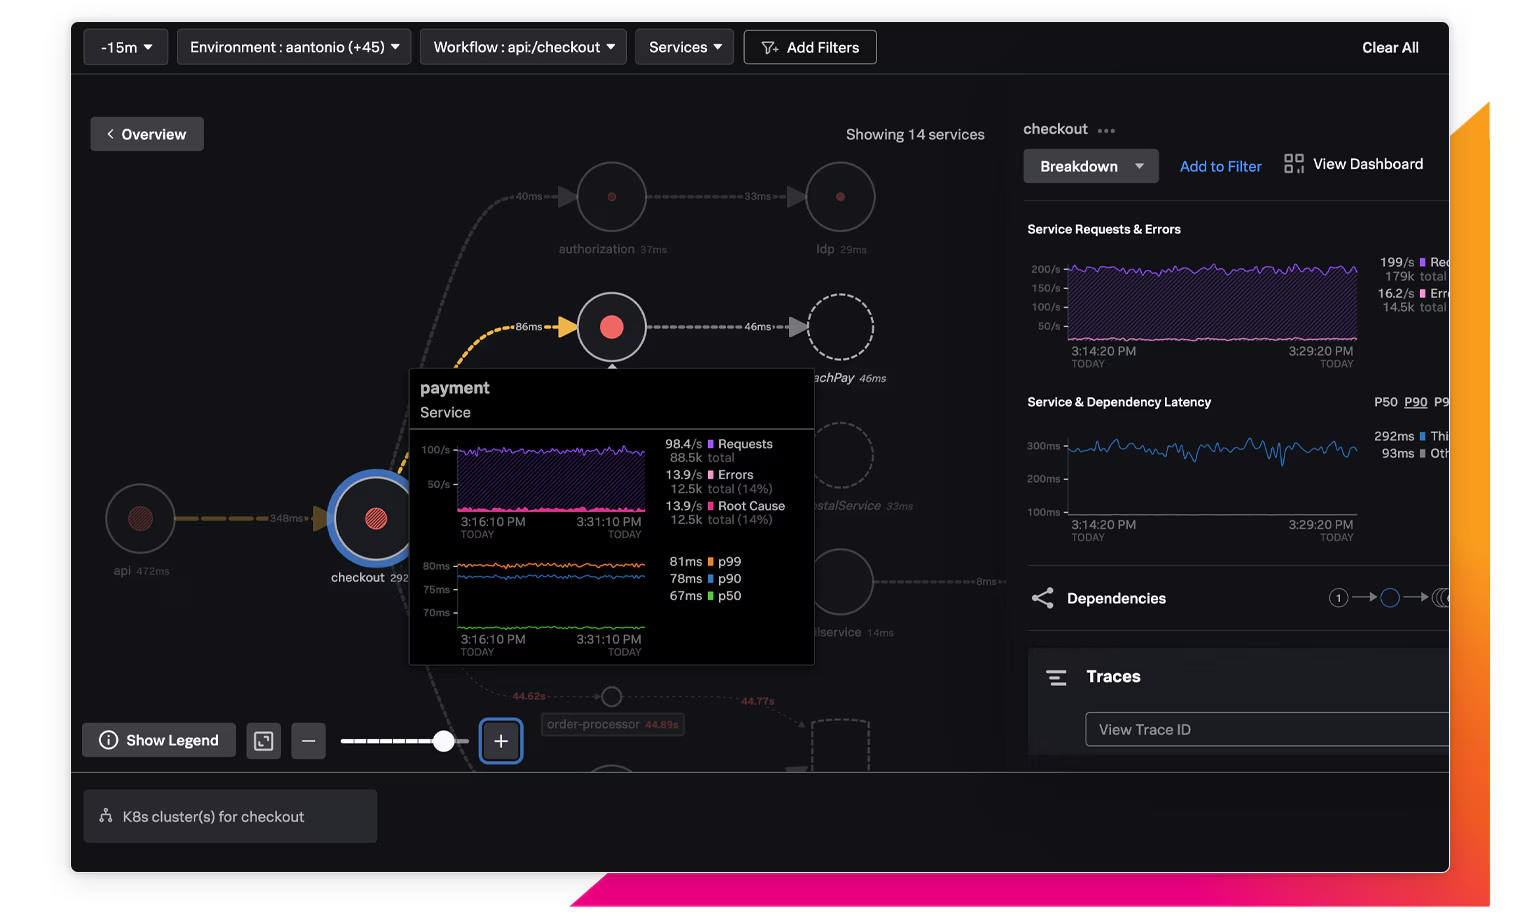
Tap into AI-guided insights
In an environment with tens or hundreds of microservices, it’s hard to know which one is causing an issue. Splunk APM gives you the power to identify the problematic service at a glance with AI-guided insights.
Enable full-context troubleshooting
As part of Observability Cloud, Splunk APM provides you with all the application, infrastructure, front-end and log data you need to quickly identify the root cause of any issue.
Gain full control of your data
Splunk APM is OpenTelemetry-native, so you can instrument once and send your data anywhere. You have the flexibility to add any tag you want, and pay for it only if you index it.
Features
End-to-end visibility and no blind spots
Full visibility into all the data from every system dependency and at any scale helps you troubleshoot complex environments significantly faster.
Service map
Identify the problematic service at-a-glance with automatically generated solid red dots that highlight the service at the root cause of an issue.
Tag spotlight
Immediately identify what problematic traces have in common, whether it’s infrastructure, code or business logic.
Trace analyzer
With 100% of traces stored, search for any trace based on any combination of their tag values, errors or latencies.
AlwaysOn Profiling
Continuously monitor CPU and memory consumption of code written in Java, .NET and Node.js with built-in code profiling.
Related Content
Troubleshoot faster with built-in correlation of trace, profiling, infrastructure metrics and log data.
Database query monitoring
Receive alerts on slow response times or problematic queries for commonly used databases.