
Gain real-time visibility into production, quality, and MRO operations with Solumina Manufacturing Intelligence for intelligent decision-making.
Vendor
iBASEt
Company Website
Solumina Manufacturing Intelligence (MI) by iBase-t provides visibility into every process, enabling intelligent decision-making in an Industry 4.0 world. It transforms raw data into structured manufacturing intelligence to support critical decisions. Solumina MI synthesizes data from across operations to track performance against business goals. It enables visibility across production, quality, and MRO operations, contextualizing operational shop floor data into measurable business performance targets. MI transforms data from the Solumina transactional database to the MI data warehouse in a consumable format via the ETL process. Preconfigured calculations are provided within the data warehouse to analyze data efficiently for actionable solutions and overall improved situational awareness. Leverage MI to gain granular visibility into operations and control how real-time data is collected, contextualized, and measured.
Features:
- Flexible Visualization Options: Solumina MI’s open architecture enables data to be visualized in a variety of BI reporting tools. Leverage customizable preconfigured dashboards or use your preferred BI reporting tool to create new visualizations.
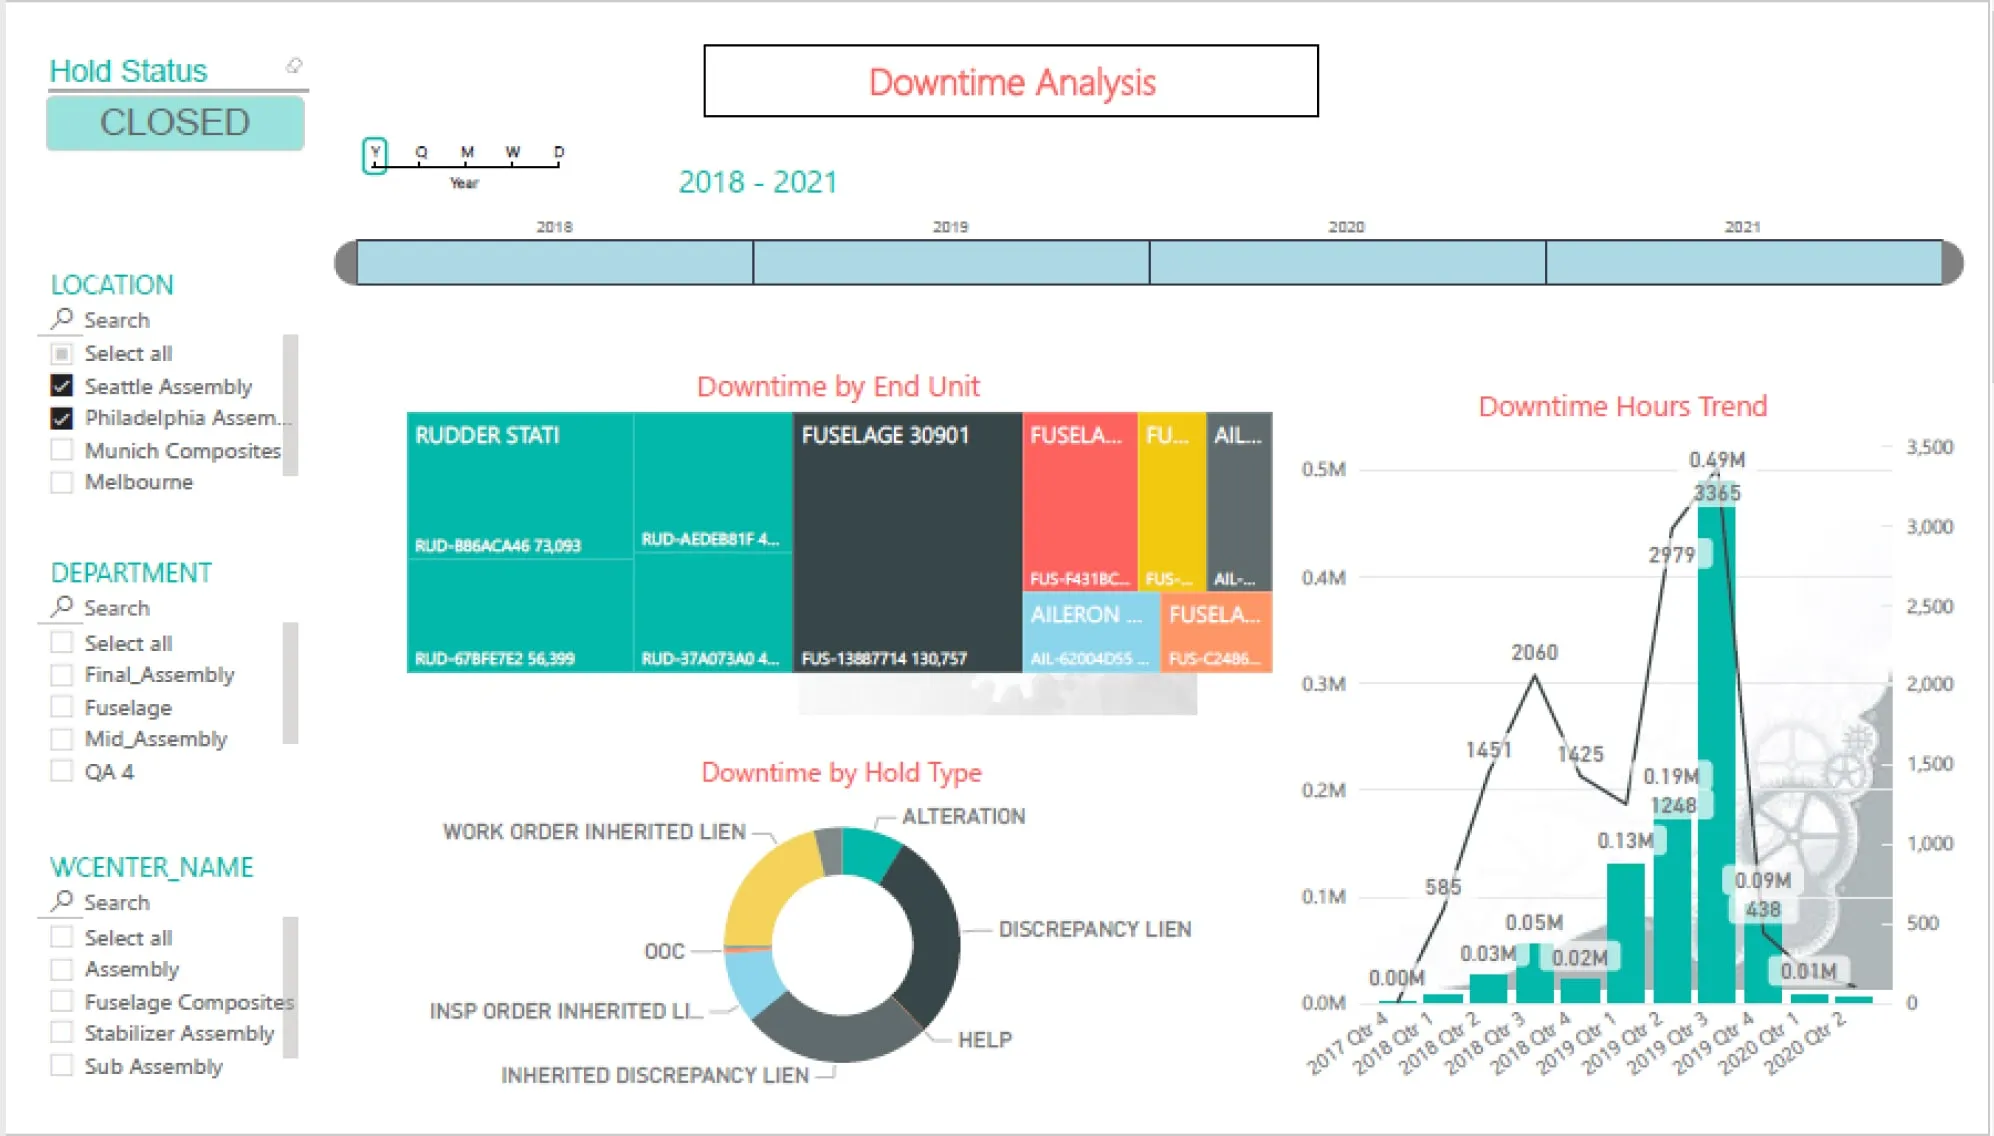
- Preconfigured Reports: Access user friendly, out-of-the-box reports and dashboards when you pair Solumina MI with select BI tools. Preconfigured metrics and visualizations include schedule, performance, quality, and sustainment – each allowing drilldown for greater detail.
- Streamlined Reporting: Paired with your preferred BI reporting tool, Solumina MI makes reports from disparate systems—which once took hours to run and manage—available in minutes, and accessible anywhere, anytime. Extend visibility by accessing data from mobile iOS and Android applications and devices.
- Flexible Analysis: Analyze information related to work orders, unit holds, discrepancies, and rework flows. Apply dimensional views to slice and dice data by location, department, or work center; by program, model, or project; by product or serial number; by cause, defect, or category type; or by hold.