
Operations dashboard for monitoring and managing NServiceBus message-driven systems.
Vendor
Particular Software
Company Website
ServicePulse is an operations and monitoring tool designed for systems built with NServiceBus. It provides real-time visibility into the health of endpoints and the flow of messages within distributed, message-based architectures. The tool focuses on operational management rather than development. It enables administrators and support teams to monitor endpoint status, detect failed message processing, and retry messages directly from a web-based interface. ServicePulse integrates with the NServiceBus platform and uses collected monitoring data to present a centralized overview of system activity. It is intended to help teams maintain system stability, quickly resolve processing failures, and reduce operational downtime in distributed environments.
Key Features
Endpoint Monitoring Displays the operational status of message-processing endpoints.
- Online/offline status detection
- Heartbeat monitoring
- Centralized endpoint overview
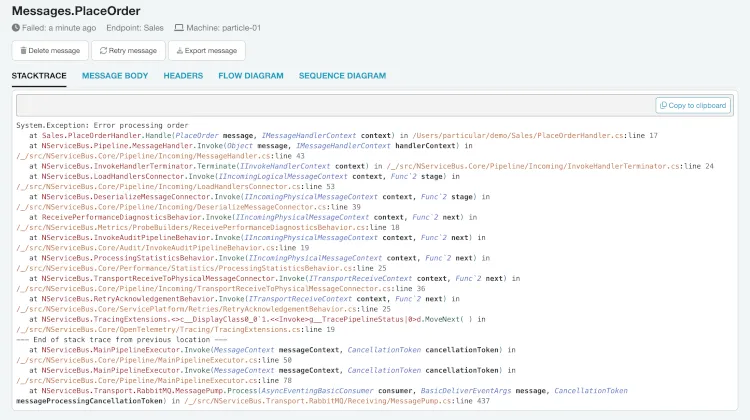
Failed Message Management Provides tools to handle processing errors.
- View failed messages
- Inspect error details
- Retry messages individually or in batches
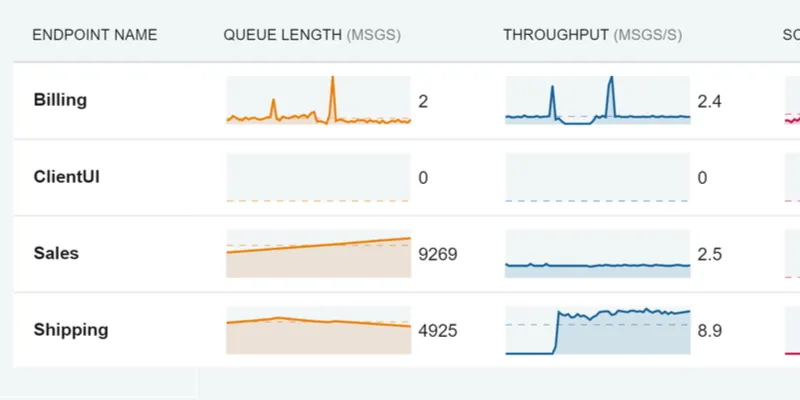
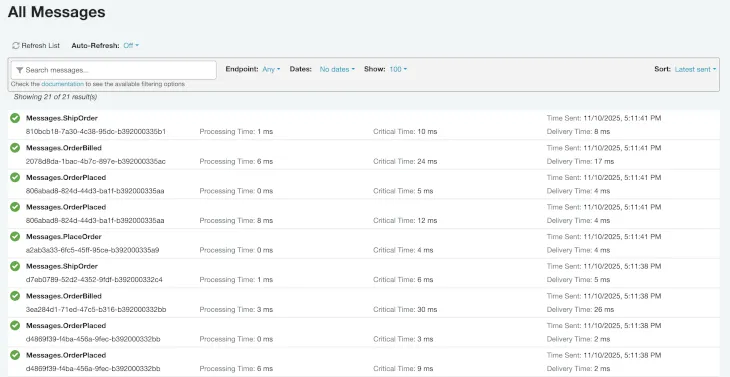
Real-Time System Overview Offers insight into system activity.
- Message processing statistics
- Throughput visibility
- Operational summaries
Web-Based Dashboard Accessible user interface for operations teams.
- Browser-based access
- Central monitoring point
- Role-based operational use
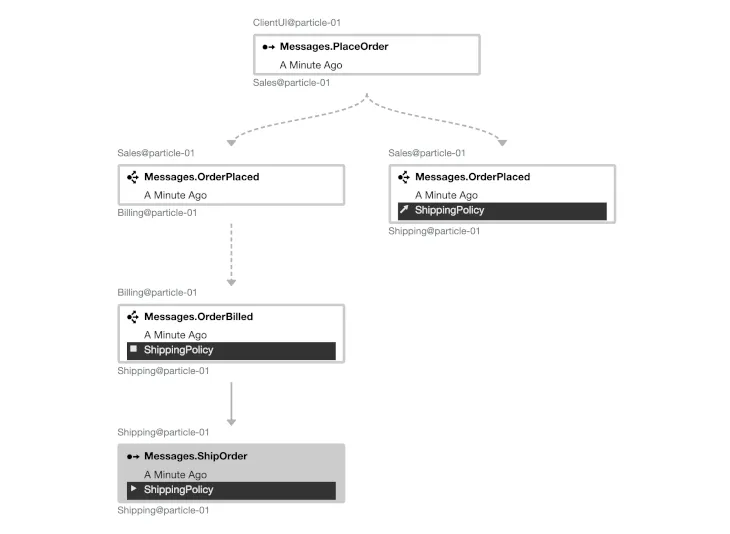
Integration with NServiceBus Works directly with NServiceBus infrastructure.
- Consumes monitoring data
- Connects to error queues
- Supports distributed deployments
Benefits
Reduced Operational Downtime Helps teams quickly identify and resolve issues.
- Immediate visibility of failures
- Direct retry capability
- Faster incident response
Centralized Monitoring Consolidates system health information.
- Single dashboard view
- Overview of multiple endpoints
- Clear operational status indicators
Improved Reliability Supports stable message-driven systems.
- Proactive error detection
- Structured failure handling
- Continuous monitoring
Operational Efficiency Simplifies support workflows.
- No manual queue inspection
- Clear failure diagnostics
- Accessible via web interface