
Intuitively organize and present information with data visualization capabilities built directly into your CRM and Tableau.
Vendor
Salesforce
Company Website
See, interact with, and better understand your data.
Move beyond pretty dashboards with AI-enhanced data visualizations that drive action right in the flow of work. Tap into the art of combining insightful analysis with expert storytelling to optimize the impact of enterprise data and make better, smarter decisions.
Connect the dots between data and insights with best-in-class data visualizations.
Drag and Drop Analytics
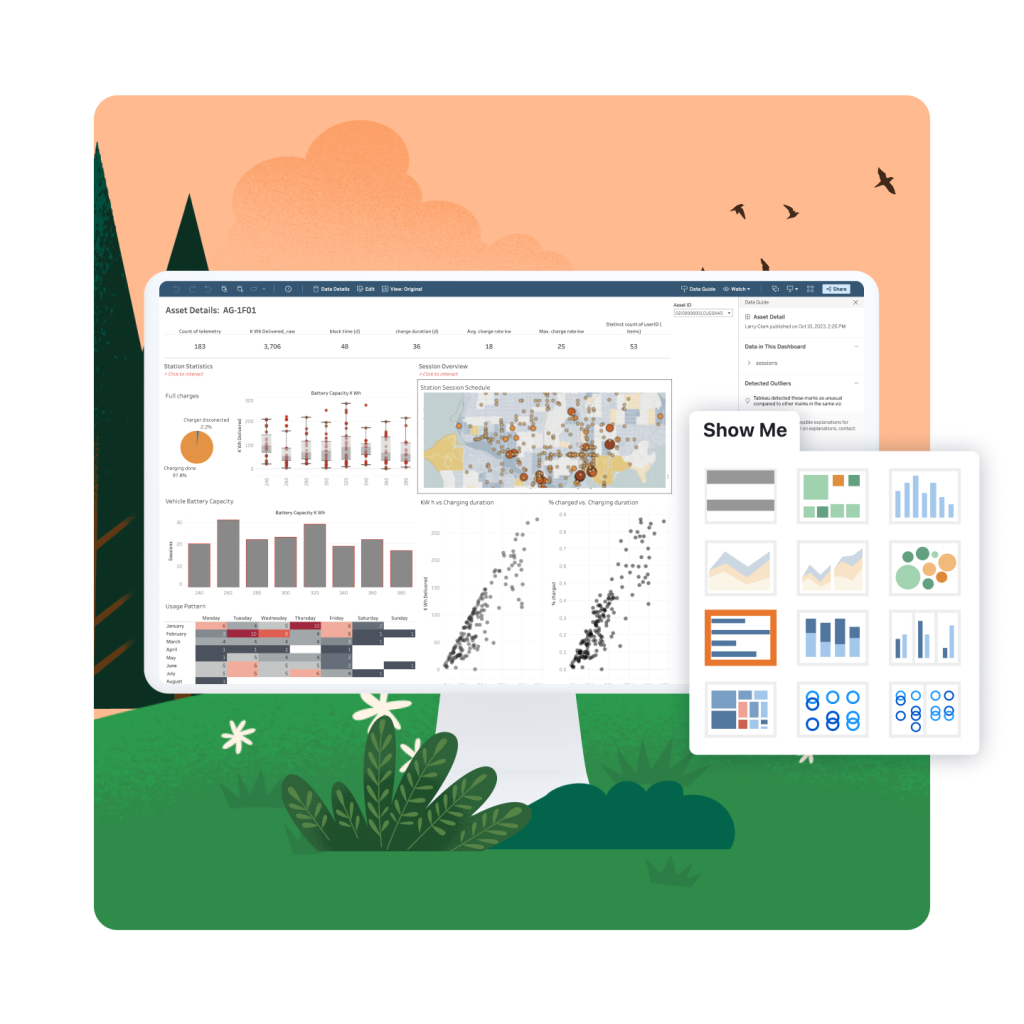
Unlike traditional methods where you’d painstakingly build charts and graphs from scratch, Tableau lowers the barrier to entry with an intuitive, drag and drop interface. Create, engage, and interact with data by building data visualizations in Tableau.
Extensive Visualization Library
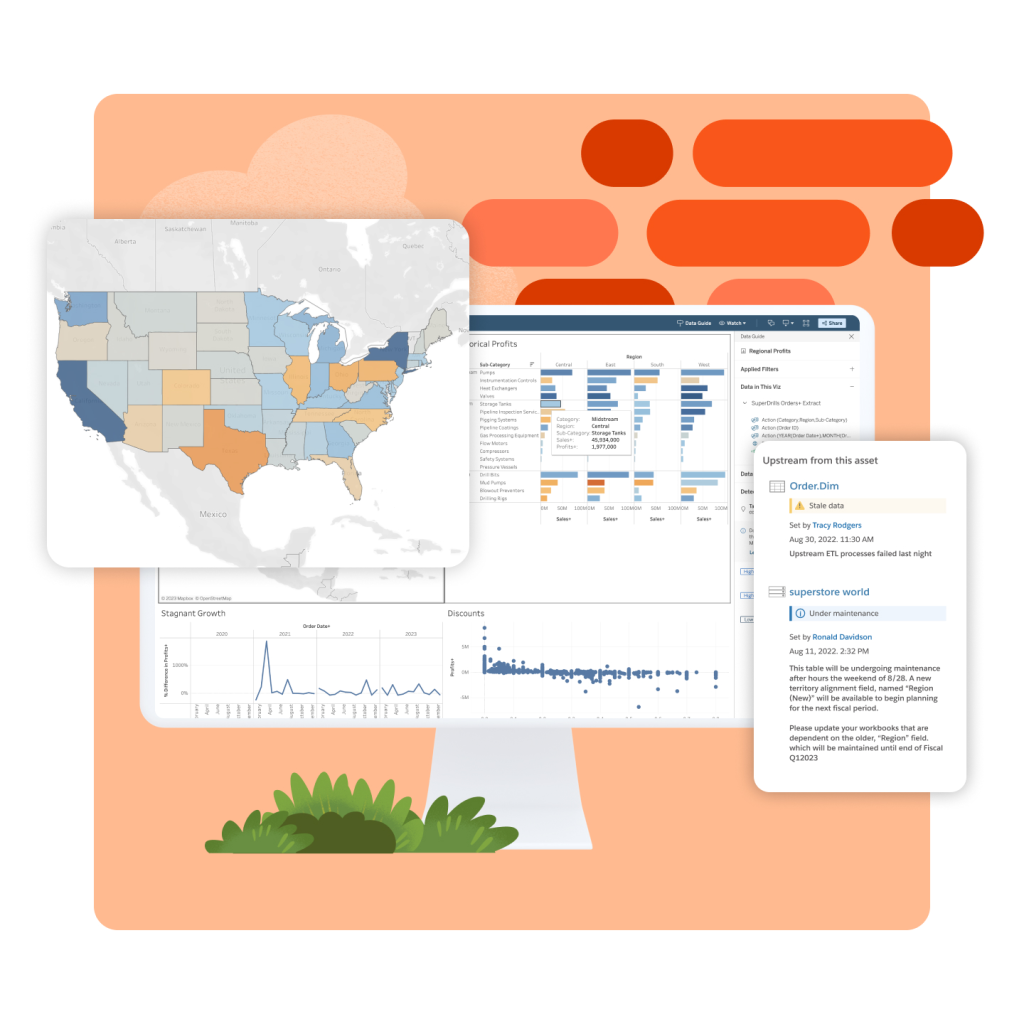
Informative, multi-dimensional, comprehensive and beautiful, data visualization tools in Tableau empower everyone to organize and present information intuitively. Tap into an extensive data viz library, including geospatial insights and more, to tell visual stories around data trends, outliers, and patterns.
Cataloging in the Flow
Access lineage and provenance of data sources in the analysis process to help choose the correct data and know and trust its freshness and origin.
Automate data visualizations for the metrics that matter most to you.
Personalized Homepages and Digests
See the metrics and insights that matter most to you and your work—curated into a personalized digest. Activate your team to focus on the same shared goals, without having to dig for information across several data sources, to make appropriate and timely decisions.
On-demand Exploration
Understand the “why” behind your insights with follow-up questions—simply type your own or follow guided question suggestions from AI in Tableau. Get digestible answers from Tableau Pulse that pair plain, natural language insights with data visualizations.
Build Dashboards Faster
Use natural language to quickly set up dashboard actions and speed up repetitive tasks, such as applying your organization's custom formatting.
Embed visualizations wherever you need to create custom data experiences.
Embedding Playground
Access an interactive learning environment where you can rapidly develop embedded analytics solutions. Get hands-on experience embedding, customizing, and integrating Tableau with your application.
Flexible Deployment
Quickly build visualizations and dashboards with an easy authoring experience, then embed them within your applications with a few lines of code using the Embedding API. You'll be able to maintain the seamless look and feel of your brand, while leveraging the frameworks and programming languages your developers already know.
Web Authoring
Edit, update, and create new content without ever leaving your preferred application. Jumpstart development and customization by adding unique features to dashboards using Tableau Extensions.