
NetScaler application and ADC health monitoring simplifies setup and maintenance with five steps to define health rules. It provides detailed data on application and ADC health, integrates with Prometheus, Grafana, and Splunk, and offers instant visibility into server issues.
Vendor
NetScaler
Company Website
Application and ADC health monitoring with NetScaler
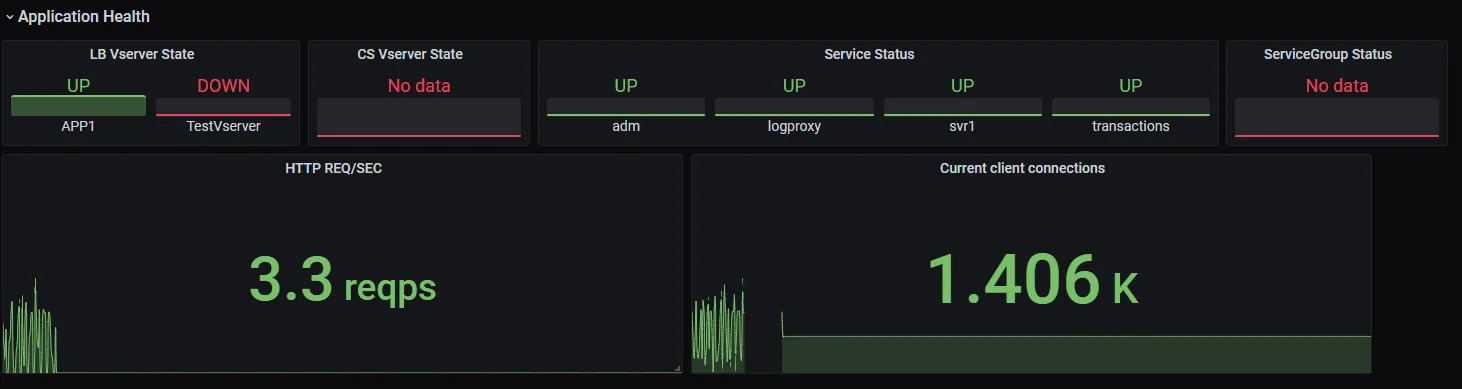
Most solutions for application and ADC heath monitoring are complex to set up and maintain. With NetScaler, there are just five steps to define a set of health rules that map to your main performance indicators to measure the health of your ADCs and applications. The NetScaler management plane provides detailed data about application and ADC health and monitors all components of a multi-tier application, including response times and server load. A web insights feature provides instant visibility into origin server issues like error response codes or missing web objects like images or files. NetScaler integrates with Prometheus, Grafana, Splunk, and other APM/NPM tools so you can proactively monitor the performance of your microservices, get alerts, and take action before an outage happens.
Capabilities
- Automatically detect, remediate, and replace a defective server with a healthy server
- Monitor the health of NetScaler ADCs with Prometheus and Grafana
- Get Instant visibility into origin server issues like error response codes
- Make active health checks of upstream gRPC services
- Block client IPs that are causing excessive security violations
- Automatically detect application attacks and take remediation actions