
A modern data visualization tool that allows you to easily create, share, and embed visualizations from MongoDB Atlas.
Vendor
MongoDB
Company Website

What is Atlas Charts?
Charts is the only native data visualization tool built for MongoDB Atlas, giving you a quick, simple, and powerful way to visualize your data. Whether you're running a dedicated cluster, a serverless instance, using Atlas Data Federation for discovering robust insights from blended Atlas and S3 data, or your archived data is in Online Archive, Charts covers a breadth of data visualization use cases.
- Real-time business intelligence
- Powerful, in-app visualizations
- No user-based licensing
Use natural language to build visualizations Now generally available, building complex charts in Natural Language Mode is as easy as asking a question in plain English.
Quick, easy, real-time business insights Charts makes it easy to create dynamic dashboards in just a few clicks; you can even render charts using natural language. All deployments from your Atlas project are available by default, dashboards can be configured to refresh automatically, and you can easily share dashboards across your team.
Make decisions based on complex data with less effort Charts works directly with JSON data, making your analytics workflow simpler. By natively supporting the document model, you will spend less time searching for insights, and more time making decisions. No more flattening data into tabular structures like with traditional business intelligence tools.
Create modern data experiences with embedded analytics With embedded analytics in Atlas Charts, embed charts and dashboards into any application. Use an iframe to quickly embed a chart, or use our embedding SDK for greater control and customization. Deliver powerful insights and relevant data to users where they need it.
Power insights across your organization With powerful functionality like granular sharing with individual team members, flexible organization-wide sharing, and scheduled reporting, Charts provides a powerful platform for sharing insights across your team.
Features
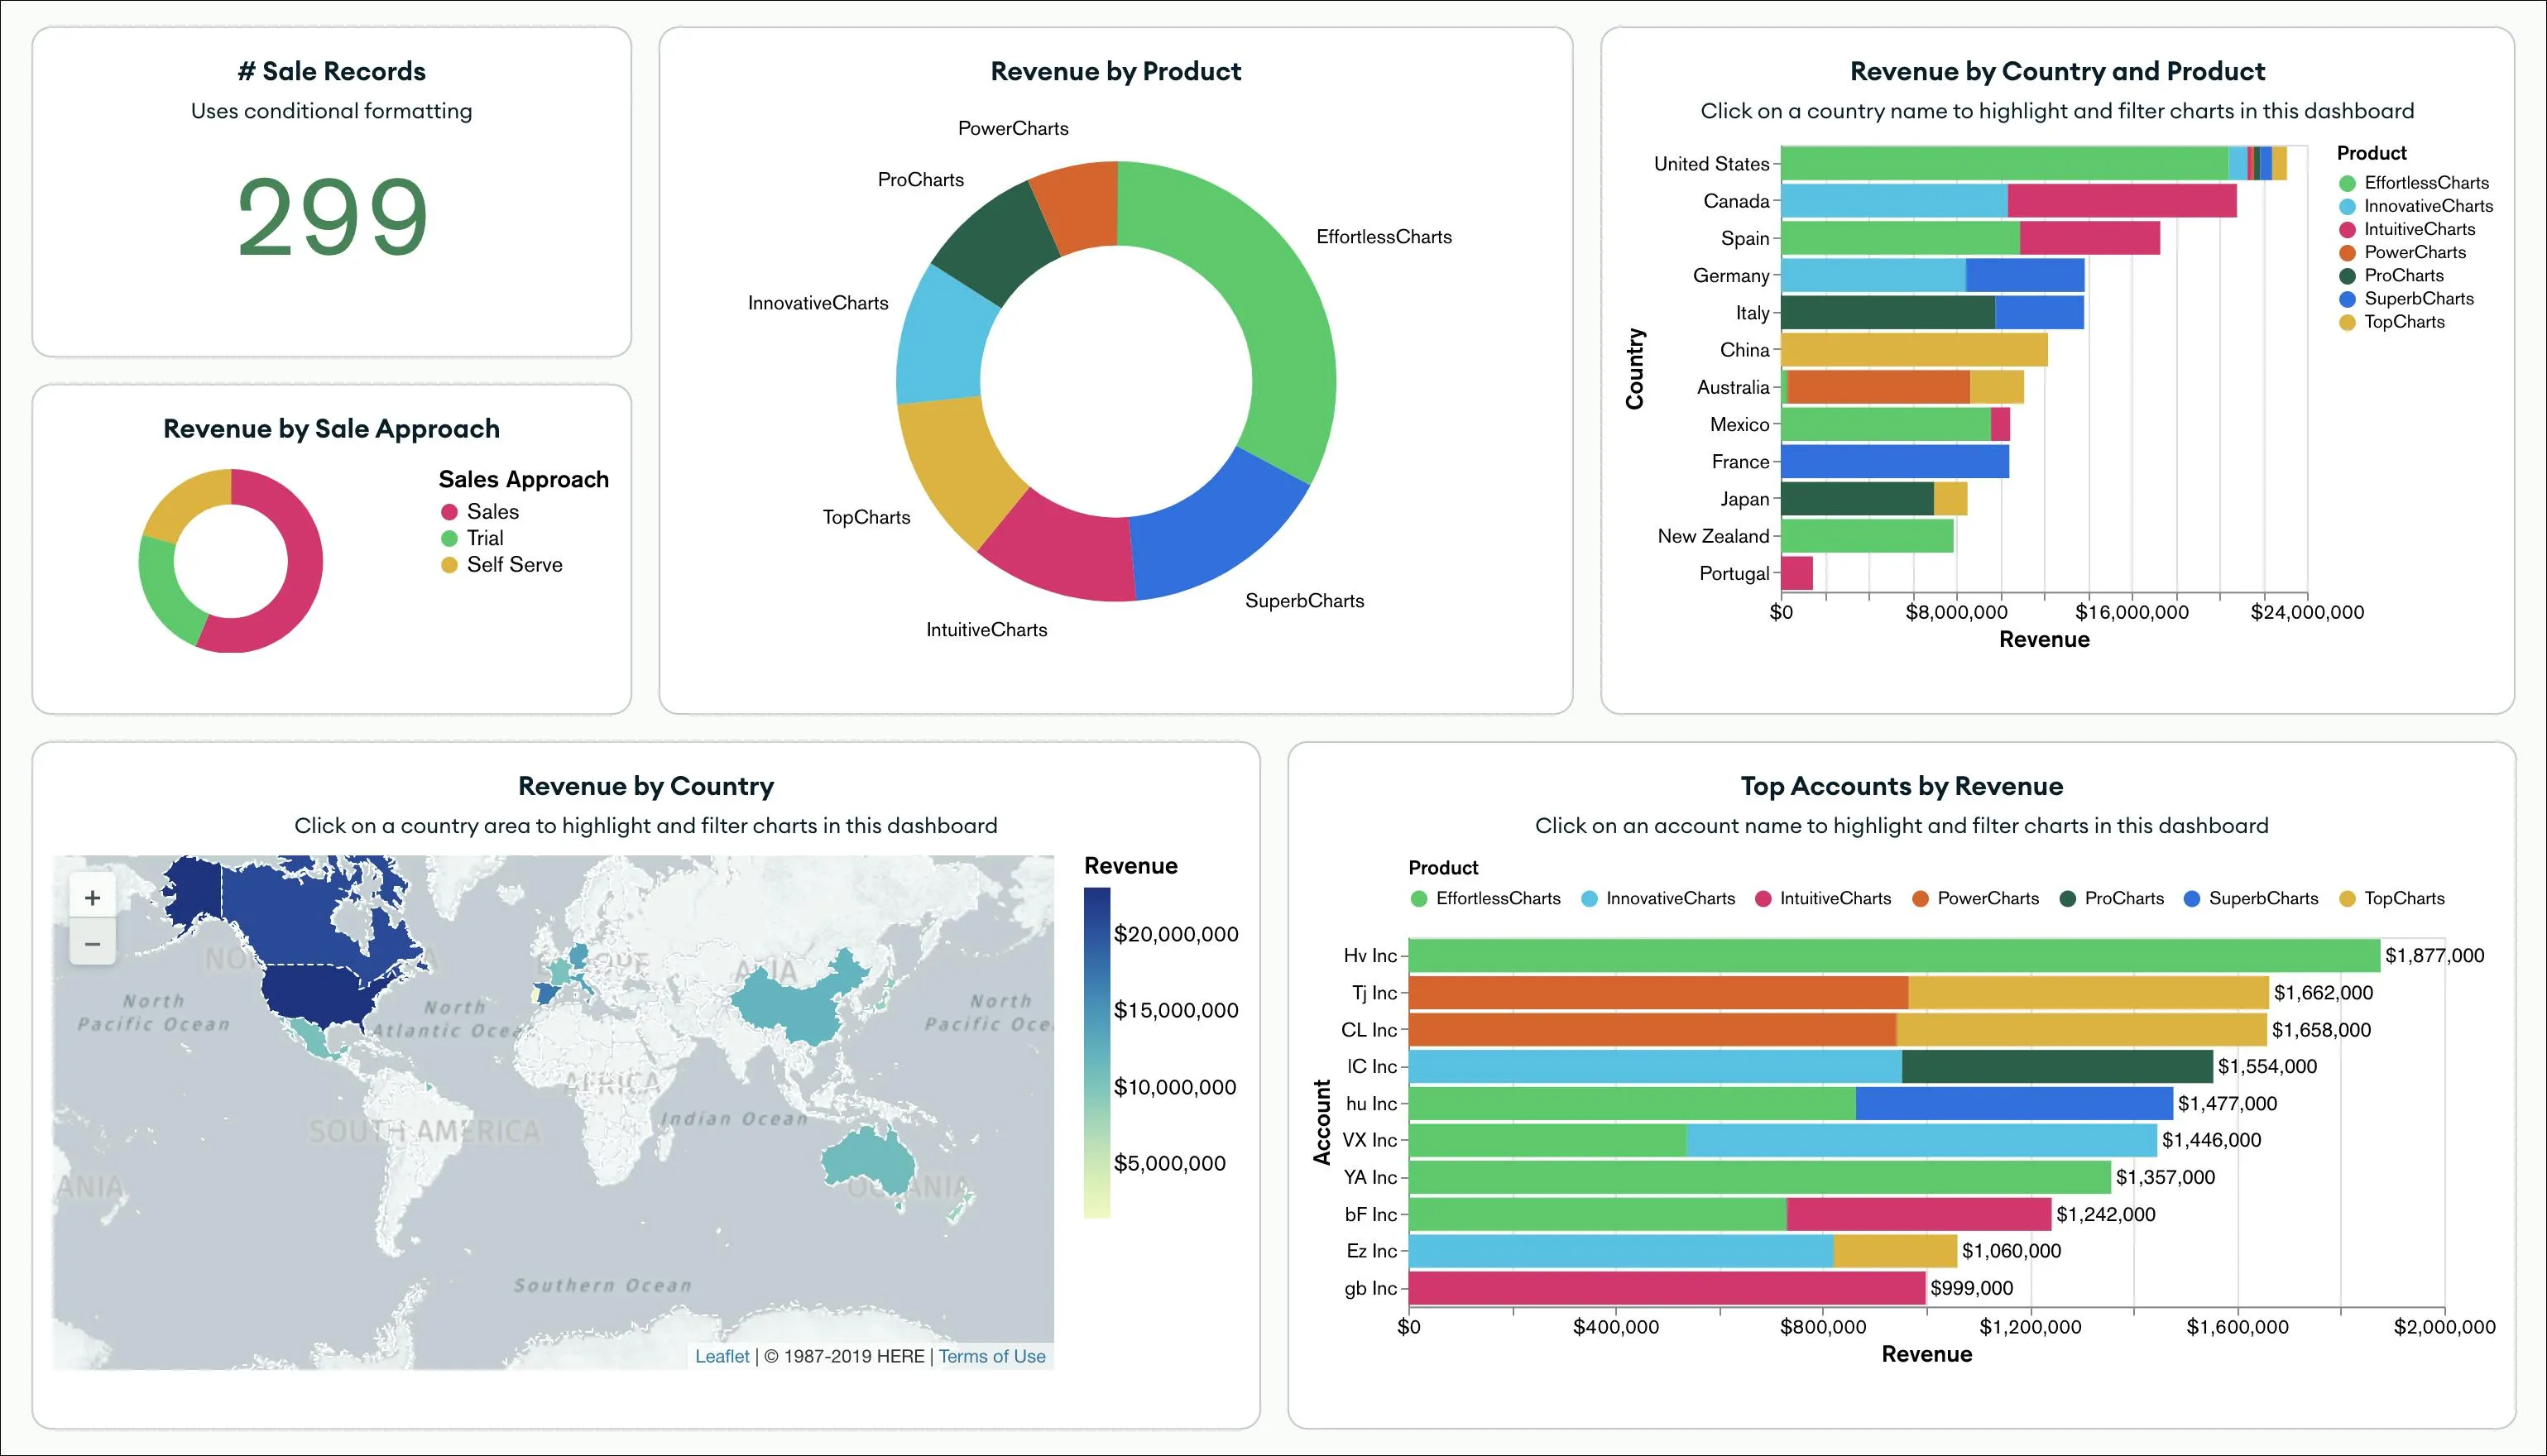
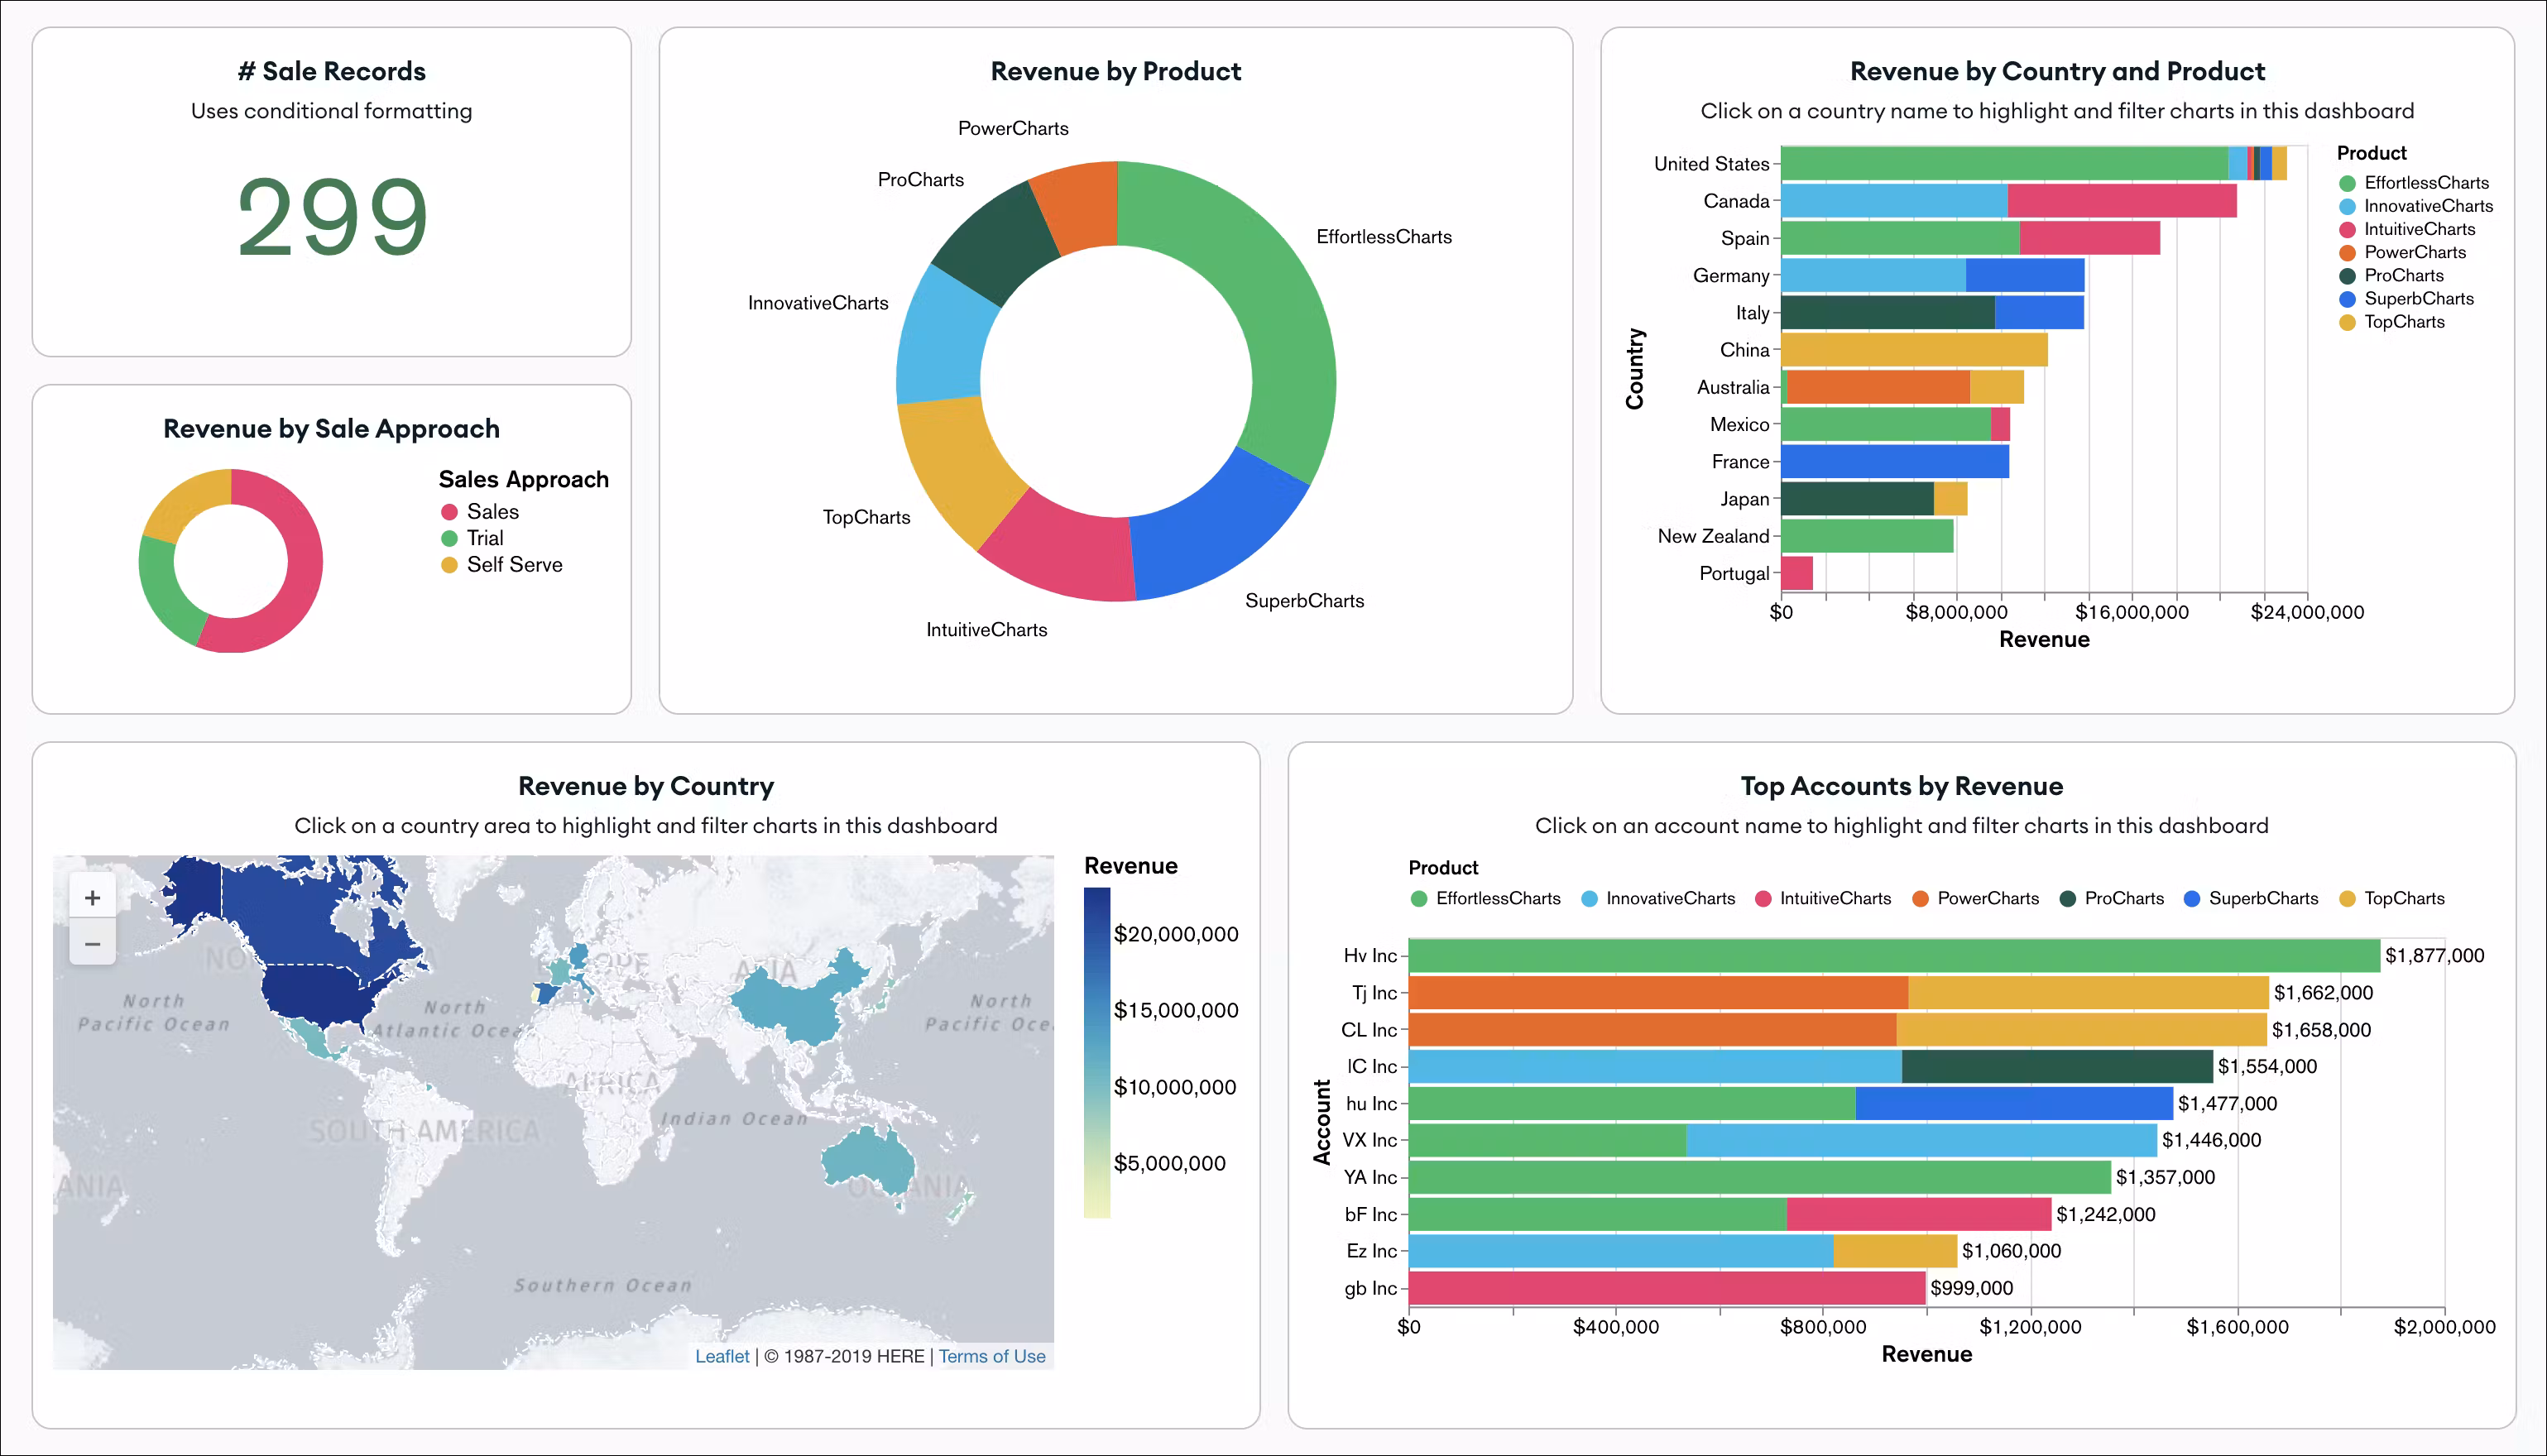
- **Sample Sales Dashboard: **Use the sales dashboard to analyze a sample collection of sales records and revenue.
- **Sample Product Dashboard: **Use the product dashboard to analyze a sample collection of product event metadata.
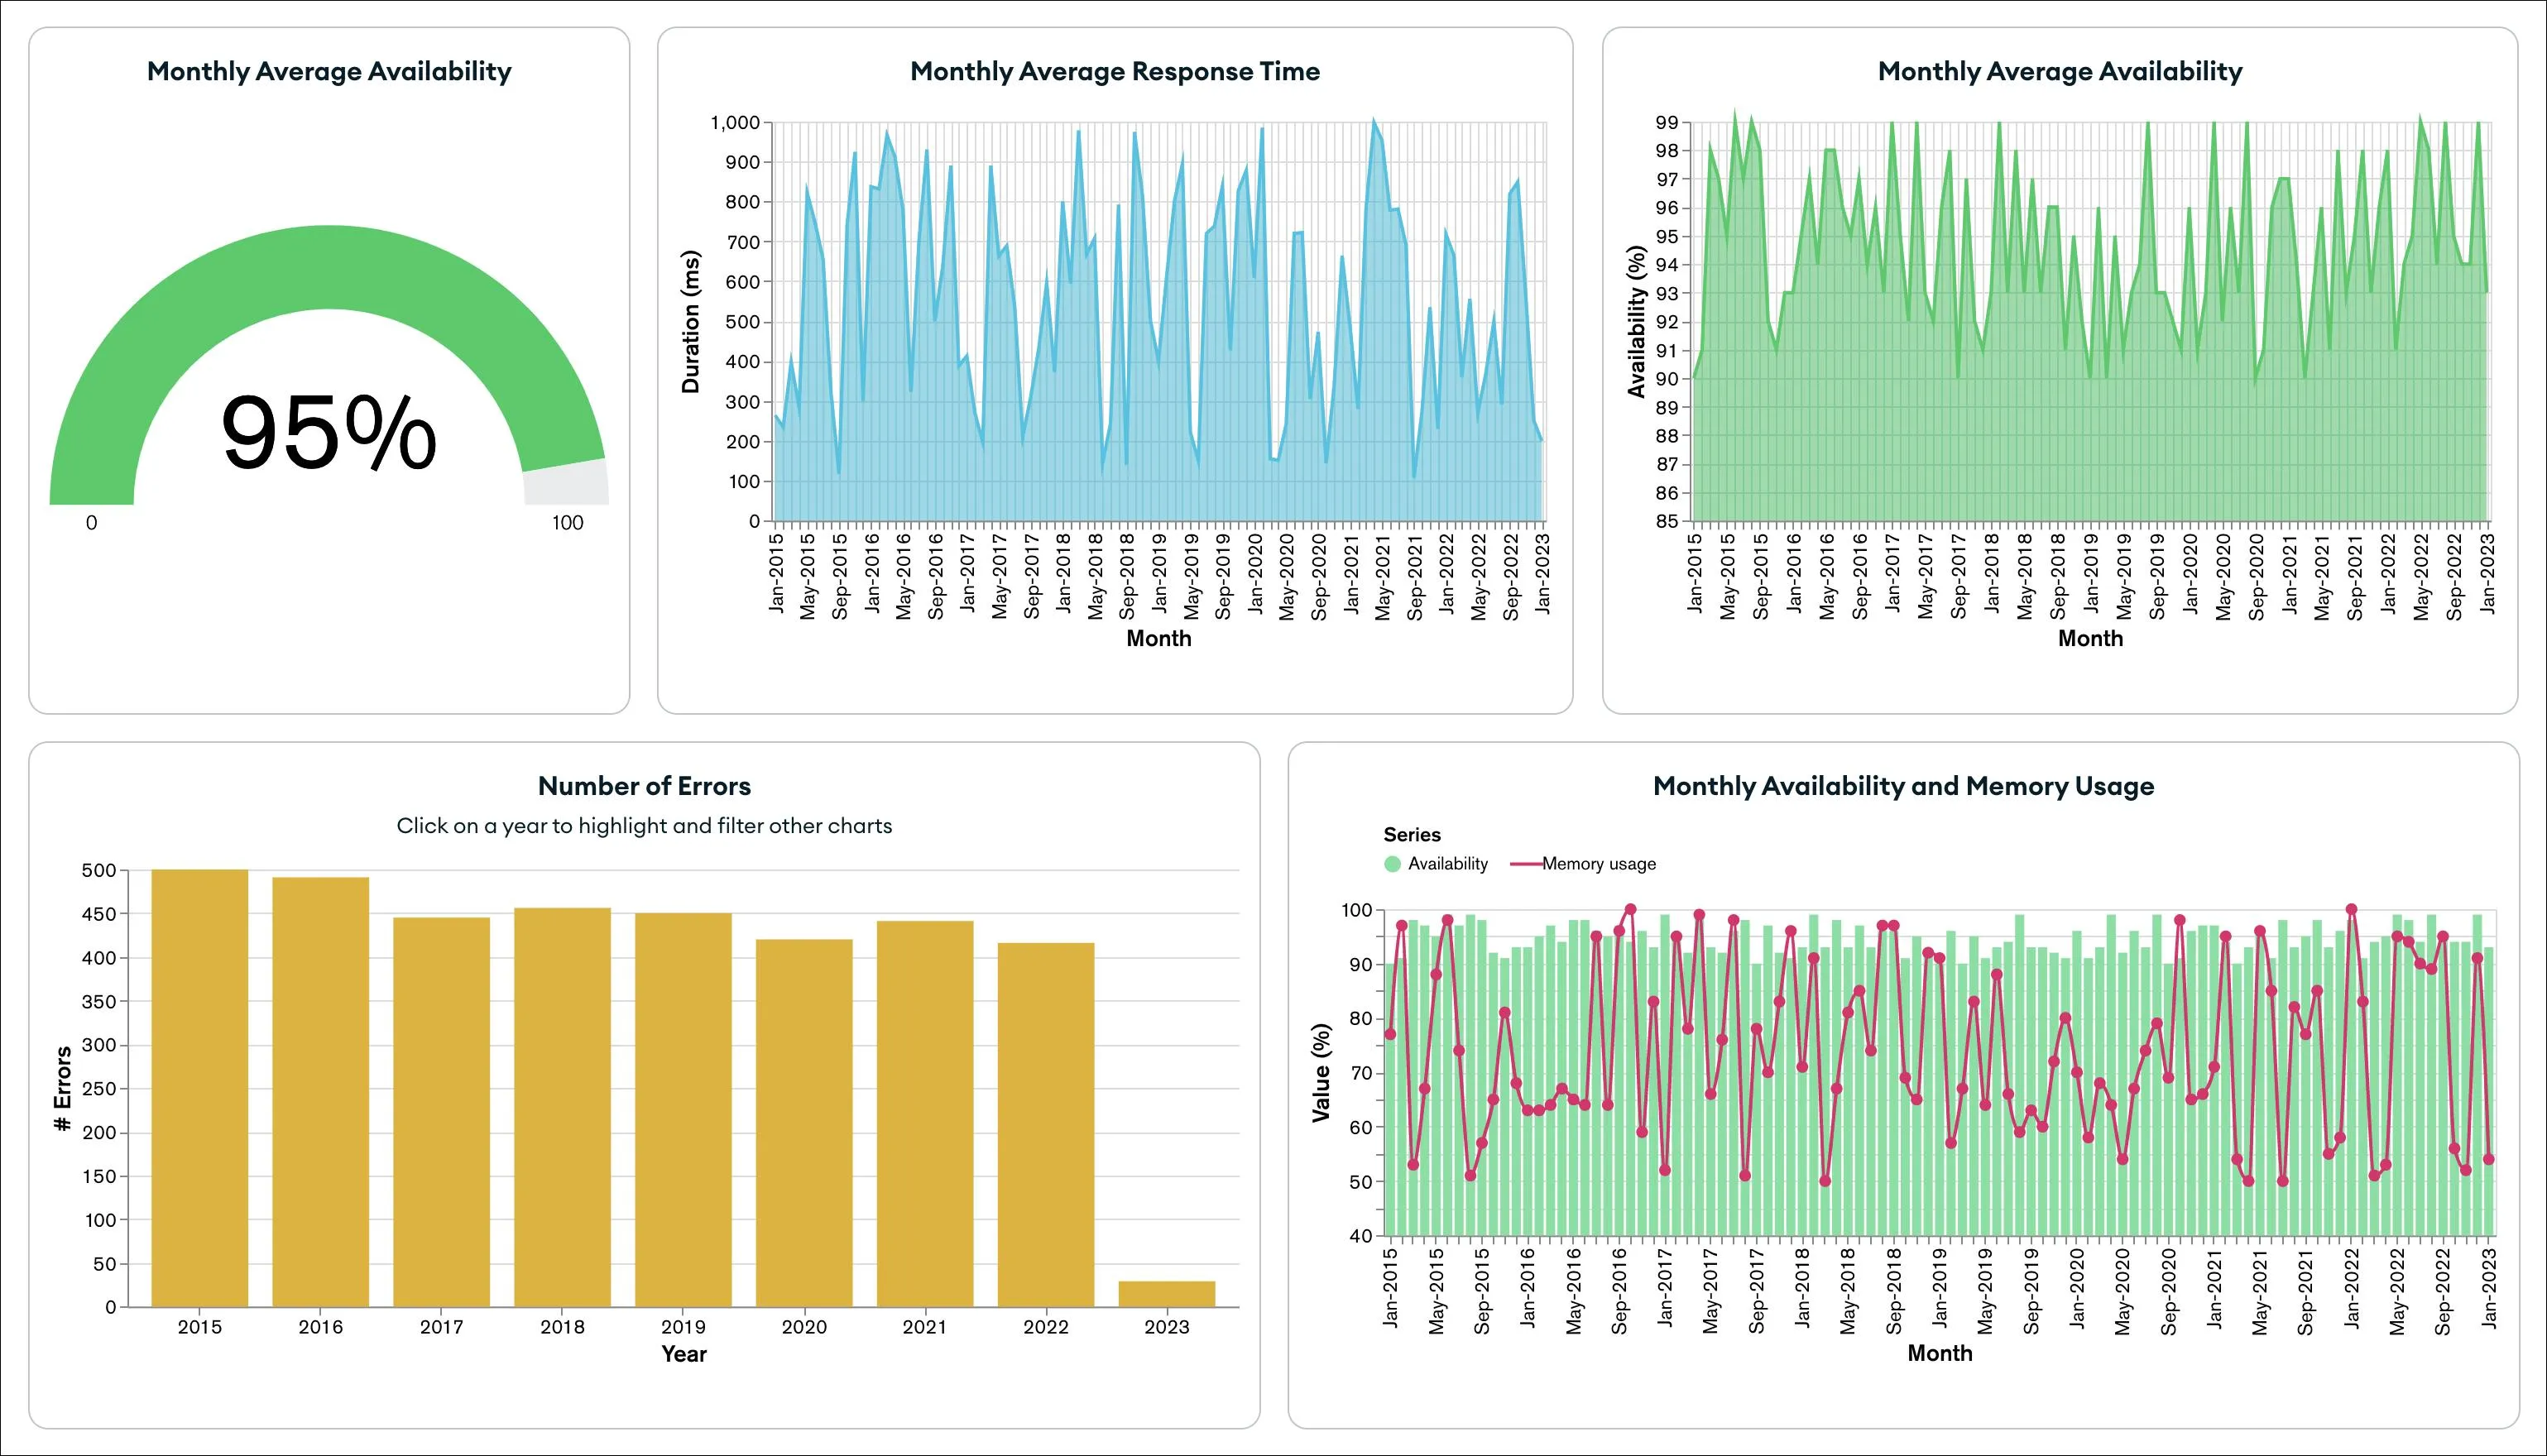
- **Sample Observability Dashboard: **Use the observability dashboard to analyze a sample collection of system metrics.
- **Sample IoT Dashboard: **Use the IoT dashboard to analyze a sample time series collection of personal activity tracking.
- **Sample Movies Dashboard: **Use the movies dashboard to analyze a sample collection of movie ratings and releases.