
Design and deploy analytics apps at the speed of AI.
Vendor
MicroStrategy
Company Website
Amplify productivity with AI
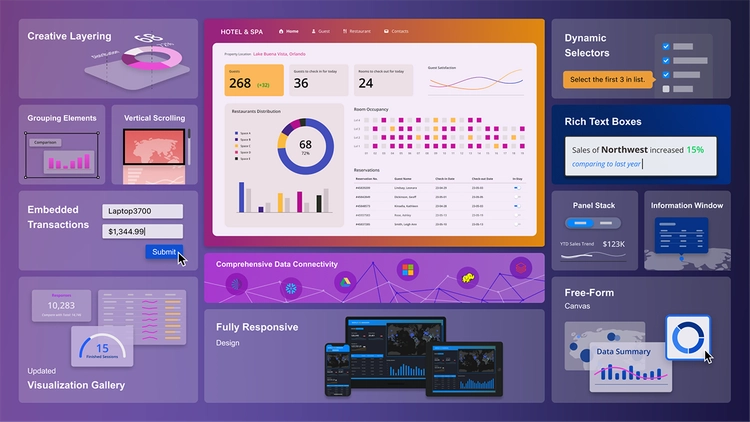
Auto Dashboard allows users to enter an entirely new world of free-form design - automatically. With expanded data preparation capabilities and our most advanced analytics functionality to date, users can interact with AI chatbots to build visualizations, reports, or entire applications. Continue conversation with the chatbot to add in transactional grids, information windows, and what-if analysis options.
Get creative with visualization types
Auto Dashboard builds with intention based on the questions you ask and the datasets it has to work with. It might select simple KPI visualizations to easily showcase key metrics. Sankey charts to display data workflows and connections at a glance. Microcharts to show progress towards goals. Transactional grids for enhanced user interaction. Or add in-canvas linking or cross-page navigation for epic data storytelling. It knows exactly what to do.
Accelerate analysis with AI-powered apps
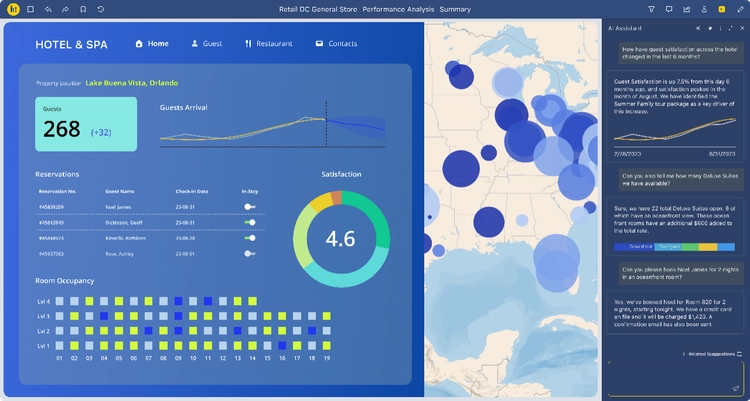
Embedded directly in apps, end users have access to their very own AI assistant. Using natural language, ask questions about the dashboard or underlying data itself without the need to navigate complex interfaces or navigation manually. Ask for data points, data summaries ready for presentation, or even update the current view by tasking the chat to make updates. Extract deeper insights to optimize decision-making.
Features
Data Visualizations
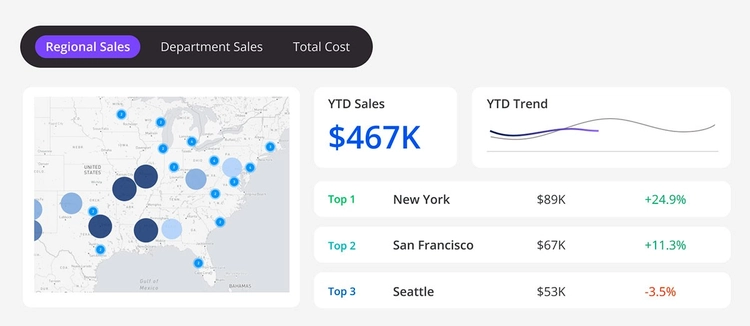
For self-service or at scale. Easily slice and dice the data to discover new insights. Select from Line, Area, Waterfall, KPIs, geospatial maps, and more. Or import custom visualizations.
Business Reports
Leverage grids and specific formatting options for optimized display. Add row-level security for individual users. Save and schedule reports.
Advanced Apps
Think outside the box. A dashboard can now be used as the homepage of an application. Integrate features such as Panel Stacks or Information Windows.