
Managed Service for Prometheus is a cloud-native metric monitoring platform that is compatible with the open source Prometheus ecosystem. Managed Service for Prometheus provides an all-in-one metric monitoring platform for different roles such as O&M engineers and site reliability engineers (SREs). It also provides monitoring and alerting services for various scenarios, such as custom business monitoring, application component monitoring, cloud service monitoring, container monitoring, and system monitoring.
Vendor
Alibaba Cloud
Company Website

Overview
Managed Service for Prometheus is a cloud-native metric monitoring platform that is compatible with the open source Prometheus ecosystem. Managed Service for Prometheus provides an all-in-one metric monitoring platform for different roles such as O&M engineers and site reliability engineers (SREs). It also provides monitoring and alerting services for various scenarios, such as custom business monitoring, application component monitoring, cloud service monitoring, container monitoring, and system monitoring.
Better Performance
Compared with open source Prometheus, Managed Service for Prometheus improves the performance of data collection by 20 times. Managed Service for Prometheus supports data queries of long time intervals within seconds and globally aggregate queries.
Cost-effectiveness
Managed Service for Prometheus provides fully managed services that reduce O&M costs by 90%. You are charged based on the number of metrics, and a large number of free metrics are provided.
Higher Availability
Multiple replicas can be deployed to support the scale-out of data collection components. Distributed storage in the cloud ensures data reliability.
Features
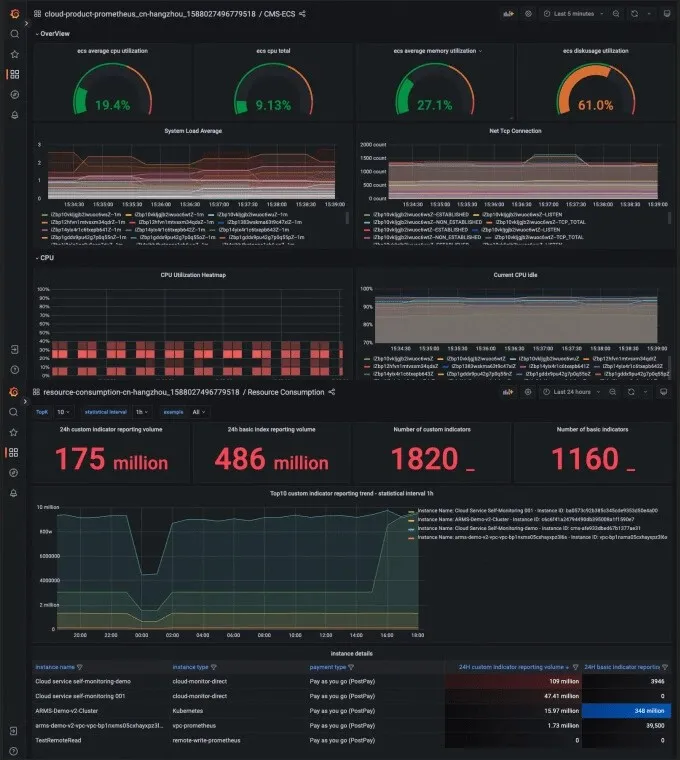
Specialized Containers for Full-stack Monitoring and Integrated Metric Monitoring Dashboards
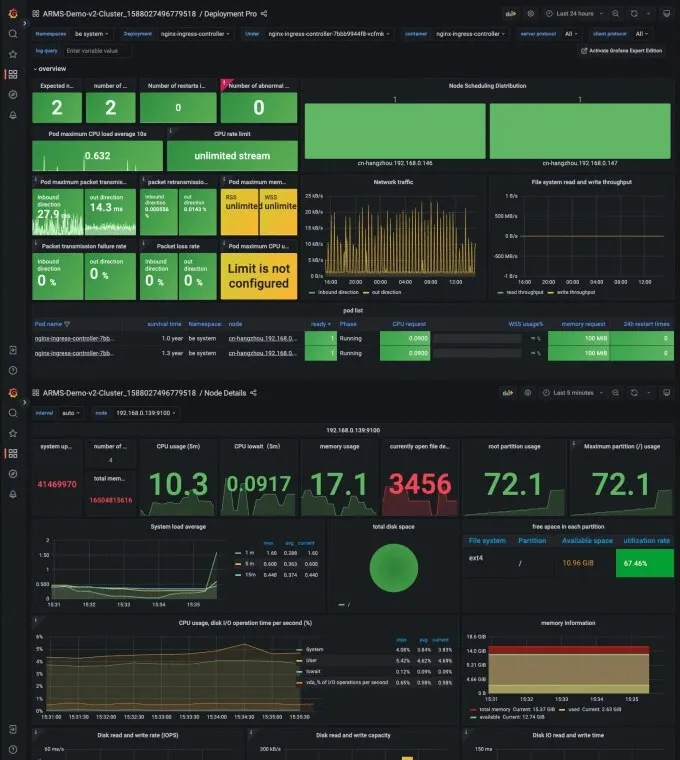
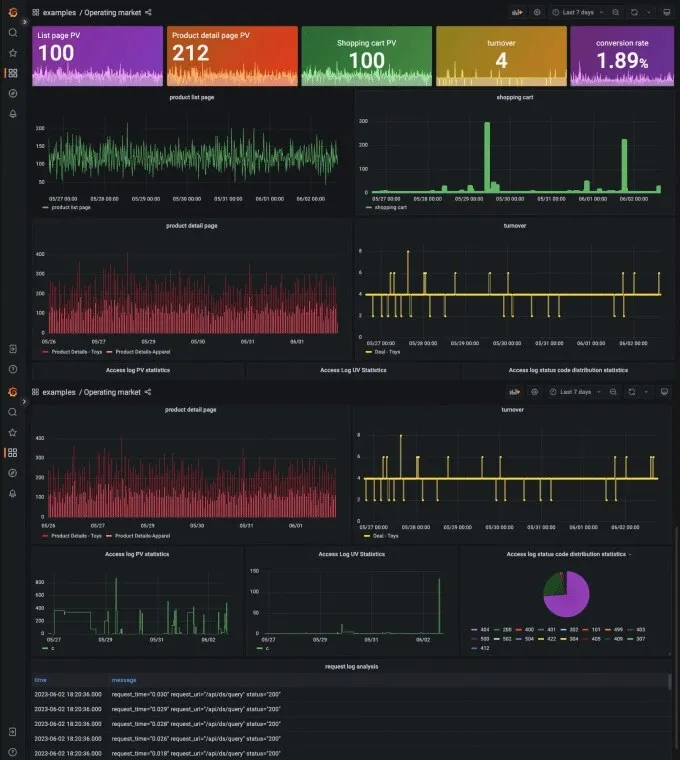
Covers business monitoring, application component monitoring, cloud service monitoring, container monitoring, and system monitoring. Metrics for the System Layer Provides basic metrics such as CPU utilization, memory usage, disk usage, and I/O. Multi-cloud and Multi-cluster Metrics Provides metrics for Alibaba Cloud clusters such as Kubernetes clusters and Elastic Compute Service (ECS) clusters, and hybrid cloud clusters. Metrics for the Container Layer Deeply integrates with Alibaba Cloud Container Service for Kubernetes (ACK), and provides basic metrics free of charge. Metrics for Cloud Services Provides metrics for cloud services such as databases, message queues, microservices, and storage. Metrics for the Self-managed Application Component Layer Provides metrics for self-managed application components such as middleware, databases, and message queues. Metrics for Application Performance Deeply integrates with the application monitoring and browser monitoring features of Application Real-Time Monitoring Service (ARMS) and complies with the OpenTelemetry standard. Custom Business Metrics Supports custom metrics such as the transaction rate, order placement rate, and click-through rate.
Improved Grafana Dashboards
Integrates various dashboards and alerts with a few clicks. Preset Dashboard Templates for Common Cloud Services and Application Components Provides data source configurations and preset dashboards for cloud services to display monitoring data in a unified manner. Custom Extension of Grafana Plug-ins Allows you to add Grafana plug-ins, visual templates, and data sources to meet personalized O&M and monitoring requirements. Prometheus Dashboard Templates for Mainstream Cloud Services Provides Prometheus Grafana dashboards for mainstream cloud services, such as ACK and Message Queue for Apache Kafka, to help O&M teams perform finer-grained metric monitoring. More Secure Permission Management Systems Supports Alibaba Cloud single sign-on (SSO) and Resource Access Management (RAM), and allows you to access services by using Alibaba Cloud accounts and as RAM users.
Enhanced Intelligent Alert Management
Improves the troubleshooting collaboration efficiency and alert accuracy. Multi-channel Data Push Supports more than 10 notification methods, such as Slack, DingTalk, emails, text messages, and webhooks, for timely message notifications. Improved Alert Collaboration Efficiency Allows you to collaborate on alert handling, trace alerts, and collect statistics on alerts by using the alert management, alert recording, and alert history features based on DingTalk-based ChatOps. Intelligent Noise Reduction Provides algorithm capabilities, such as exception check and intelligent noise reduction, to effectively reduce invalid alerts. Root Cause Analysis of Alerts Helps you analyze the root causes of alerts based on the application context to improve the troubleshooting efficiency.
Globally Aggregate Queries of Multiple Instances
Provides capabilities such as globally aggregate queries, unified Grafana data sources, and centralized alerting.