
Grafana Cloud’s AI-powered tools and machine learning capabilities help teams automate tedious tasks, identify anomalies faster, and optimize costs and engineering hours.
Vendor
Grafana Labs
Company Website
AI-based tools for better observability
Reduce toil
Reduce repetitive manual tasks with machine learning to minimize the toil of maintaining healthy services.
Minimize time
Get faster incident response times with automated checks to help identify anomalies and automated workflows to correlate issues.
Save money
Cut down on the added cost of scale with AI-powered tools like Adaptive Metrics, which aggregates unused or partially used metrics.
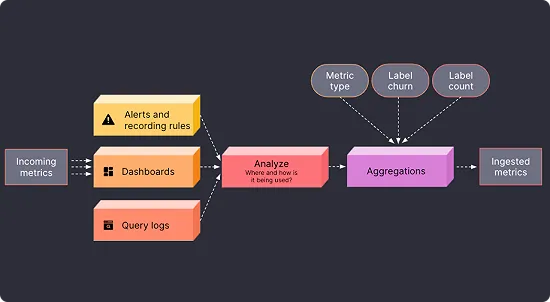
Reduce metrics volume to reduce costs
Easily identify if metrics are unused or partially used and aggregate them into lower cardinality versions with Adaptive Metrics. On average, companies have been able to reduce metrics costs by 35%.
- Receive daily updated recommendations that adapt to your usage patterns
- Apply or skip aggregations as needed with rule management directly in the UI
- Identify and isolate critical metrics that can be excluded from aggregations
Improve MTTR
Sift, Grafana Cloud’s diagnostic assistant, leverages Grafana Machine Learning to filter through data and identify the most critical incident details like error patterns or Kubernetes container failures
- Get automated checks – from error pattern logs and slow requests to Kube crashes and noisy neighbors – that make analyzing your telemetry during investigations easy
- Find log error explanations that can help guide incident response
- Automatically detect and correlate anomalies across application and infrastructure signals with Asserts.
AI observability for your stack
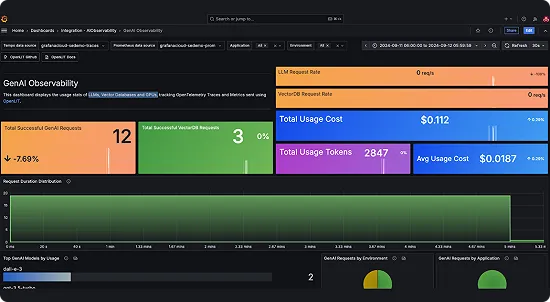
AI Observability in Grafana Cloud helps teams monitor and optimize generative AI applications with insights into LLMs, vector databases, and GPUs.
- Monitor user interactions with LLMs, such as prompts and completions, to better understand user intent and model performance.
- Track and visualize token usage for LLM interactions to optimize resource allocation.
- Monitor and analyze costs associated with LLMs in real time for effective budget management, forecasting, and cost-saving.
- Capture metadata for each LLM request, including request parameters, response times, model versions, and other details.
- Track the latency of each request to identify bottlenecks and enable prompt issue resolution.
- Monitor the performance of your vector database query response times and throughput to ensure efficient processing and retrieval of vector data queries.
Predict and detect anomalies and outliers
Grafana Cloud’s machine learning tools simplify complex systems and improve operational efficiency.
- Identify potential issues in less time using predictive analytics
- Quickly spot issues across a large number of pods with outlier detection and alerting
Run applications better and faster
Replace tedious tasks with GenAI features that reduce toil.
- Collect important post-incident review details in one click with Grafana Incident auto-summary
- Speed up troubleshooting with Flame graph AI, which interprets flame graph data via an LLM
- Create PromQL queries faster using generative AI
- Get AI-generated titles and descriptions for your Grafana dashboards
AI/ML innovation at Grafana Labs
Grafana Labs integrates observability with advanced AI and machine learning through its unique approach to innovation: developing in the open, building AI support into open source solutions, and offering zero vendor lock-ins. Developers can easily build AI/ML-powered experiences using Grafana’s LLM (Large Language Model) plugin and leveraging its open source libraries and examples. As LLMs become more prevalent in customers’ day-to-day work, Grafana Labs is also developing various ways to monitor and observe LLMs. Our engineers have explored ways to use open source tools to observe LLMs, including the OpenLIT SDK. This SDK produces OpenTelemetry traces and metrics for the LLM calls including latency, cost, and the number of tokens generated. The data can be sent to Grafana Cloud (via an integration that is open source and available on GitHub) and visualized using the AI observability solution. The team also built GPU monitoring using eBPF, which helps AI developers get fine-grained information about their workloads without manual instrumentation. This is currently available as a branch in Grafana Beyla, Grafana Labs’ open source eBPF project.