
FNT GraphicCenter visualizes and analyzes infrastructure and service data, enhancing understanding of dependencies and relationships. Integrated with FNT Command, it facilitates efficient planning, monitoring, and decision-making through high-performance graphical visualization.
Vendor
FNT
Company Website
FNT GraphicCenter
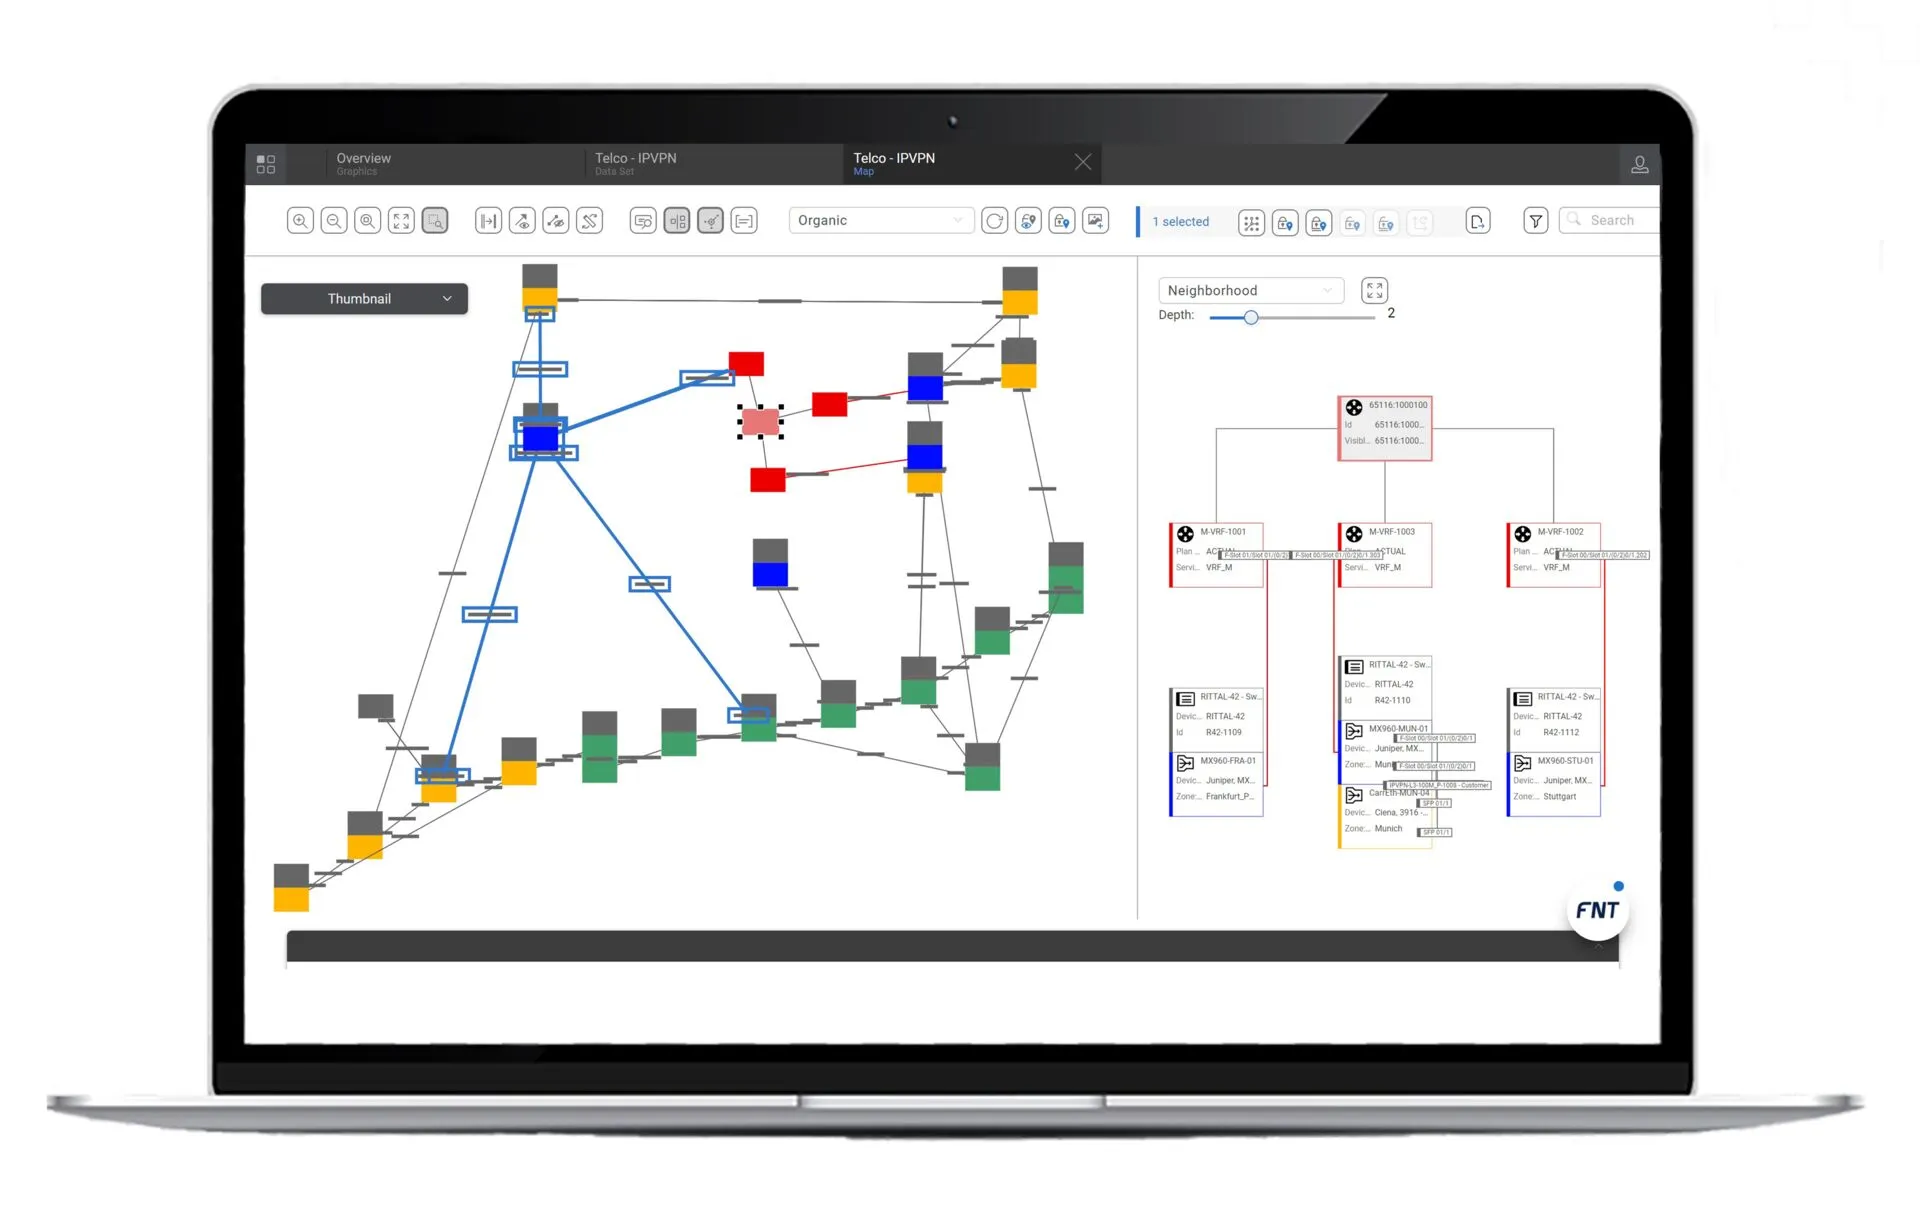
Easily analyze data and their dependencies with FNT GraphicCenter
FNT GraphicCenter allows you to easily visualize and analyze infrastructure and service data, making it the perfect companion to FNT’s other solutions. It is a high-performance visualization application that is fully integrated into the FNT Command platform and based on technology from yWorks – the market leader in graph and diagram visualization. The application enables fast and efficient analysis of networks, infrastructures, services, and their relationships through graphical visualization of assets and resources. It helps recognize patterns within the data, to visualize structures, and to gain a better understanding of dependencies. Staff responsible for planning and managing infrastructure and services are thus able to make better knowledge-based decisions. FNT GraphicCenter makes it possible to display all the relevant elements of a network, from physical network nodes and logical connections through to the service level.
Benefits
Better planning & monitoring
FNT GraphicCenter makes it possible to use data from constantly growing complex structures and/or business-critical data relationships for planning purposes and to monitor such data.
More efficient analyses
Facilitates cause and effect analysis by allowing efficient visualization and analysis of technical issues.
Faster decision-making
Faster, data-based decision-making and fault resolution thanks to visualization of relationships.
Easy Visualization
Infrastructure and service data can be easily visualized and analyzed in the form of diagrams or networks (node and edge relationships). Individually configurable element and layout styles enable flexible visualization of data, tailored to special use cases.
Flexible configuration
Data records can be flexibly configured for each specific use case. GraphQL, a widely used and powerful query language for APIs that enables flexible formulation of focused queries, is used to query the data.
Highlights of FNT GraphicCenter
- Recognize patterns in data
- Visualize the structure of data
- Discover relationships within data
- Automated data structuring