
Desktop profiler for analyzing and optimizing Entity Framework database interactions.
Vendor
Hibernating Rhinos
Company Website
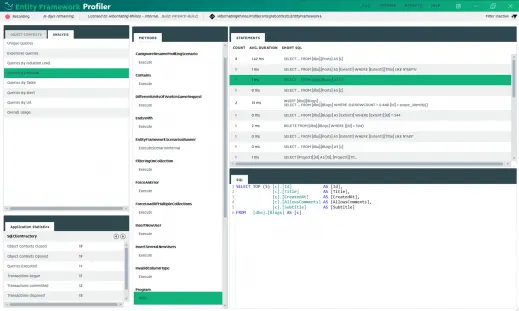
Entity Framework Profiler (EF Prof) is a desktop diagnostic tool designed to analyze database activity generated by applications using Microsoft Entity Framework. It provides visibility into SQL queries, transactions and data access behavior produced by the ORM layer. The tool captures and displays database commands in real time, allowing developers to inspect generated SQL statements, execution times, and transactional boundaries. It helps identify inefficient query patterns, excessive round-trips, and common ORM-related issues such as N+1 queries or over-fetching data. EF Prof operates externally to the application and does not require intrusive code changes. It is used during development, testing and troubleshooting to understand how Entity Framework translates LINQ expressions and object operations into SQL commands. The primary goal of EF Prof is to improve database performance, reduce latency, and ensure efficient use of database resources in applications built on Entity Framework.
Key Features
Real-Time Query Monitoring Displays SQL commands generated by Entity Framework.
- Live view of executed queries
- Execution time tracking
- Parameter inspection
- Transaction visibility
Detection of Common ORM Issues Identifies inefficient data access patterns.
- N+1 query detection
- Lazy loading misuse alerts
- Excessive data retrieval warnings
- Missing index indications
Detailed Query Analysis Provides insight into SQL behavior.
- Full SQL text inspection
- Highlighting of slow queries
- Sorting and filtering options
- Correlation with application context
Transaction and Context Tracking Monitors database interactions within application flows.
- Transaction boundary visualization
- Context lifetime tracking
- Batch operation review
- Connection usage overview
Non-Intrusive Integration Works without modifying application logic.
- External profiling approach
- Minimal configuration
- Suitable for development and staging
- Compatible with supported EF versions
Benefits
Improved Application Performance Enables optimization of database interactions.
- Reduced query latency
- Fewer unnecessary database calls
- Better resource utilization
Faster Debugging and Troubleshooting Provides immediate visibility into ORM behavior.
- Quick identification of problematic queries
- Clear insight into generated SQL
- Reduced time to resolve performance issues
Better Database Design Decisions Supports informed indexing and schema optimization.
- Identification of missing indexes
- Insight into query patterns
- Validation of data access strategies
Higher Development Quality Encourages efficient ORM usage practices.
- Early detection of anti-patterns
- Improved coding discipline
- Better collaboration between developers and DBAs
Operational Transparency Makes ORM-generated activity observable and measurable.
- Structured diagnostic information
- Clear workload visibility
- Enhanced understanding of application behavior