
DXcharts is a versatile financial charting library designed for brokers, banks, and startups. It offers customizable charts, extensive indicators, and seamless market data integration. The library supports mobile access and provides a responsive, high-performance user experience.
Vendor
Devexperts
Company Website
Financial Charting Library for Online Brokers, Banks, and Startups
Why our charts?
Business
1 day integration Your team can roll out our chart into production in hours. Label-free Your customers stay with you. We don't add any external links or logos. Easy market data integration Seamless integration of a ready-to-go solution. Provide your end-users with futures, equities, indices, FX, and crypto data. Mobile version Access DXcharts anywhere, anytime, with our native mobile library.
Technology
Access to source code Create and customize elements. Need something more? Get full access. Supersonic fast Charts stay responsive and nimble even with thousands of bars, hundreds of drawings, and dozens of indicators. Developers on demand Documentation and support are already part of the deal. Need a team? The same developers who created the charting library can help integrate it into your app.
Key functionality
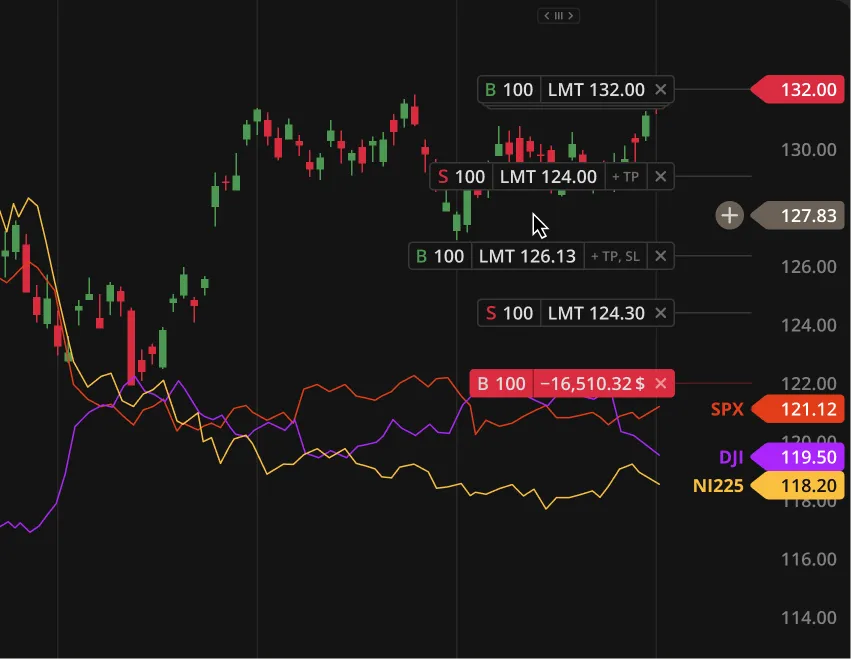
Orders & positions Work seamlessly with orders and positions directly from the chart. It’s smooth and intuitive. DXcharts libraries combine best practices from OTC and brokerage platforms. Diverse layout Juggle the layout of charts as you wish. Synchronize them by instrument, chart type, timeframe and range, studies, and appearance. Instrument comparison Compare multiple charts and analyze the market situation with simultaneously displayed charts. Custom aggregations Set the chart timeframe to any value and customize the defaults. Chart events View earnings, dividends, splits, and anything else you need for comprehensive analysis. Various chart types Take advantage of the most popular graph types to visualize the market. Extensive indicator library Evaluate securities and forecast their future movement by analyzing statistics gathered from trading activity. Create custom studies with dxScript. Drawing tools Access 40 trader-preferred drawings for technical analysis and visualization of all known price patterns.
Technology we use
- JavaScript
- HTML Canvas
- TypeScript
- Swing
- CSS
- Java
- ReactJS
- Android
- Scripting Language
- iOS