
Data VisualizationYellowfin
Yellowfin BI offers advanced data visualization tools for creating interactive reports and dashboards.
Vendor
Yellowfin
Company Website

Product details
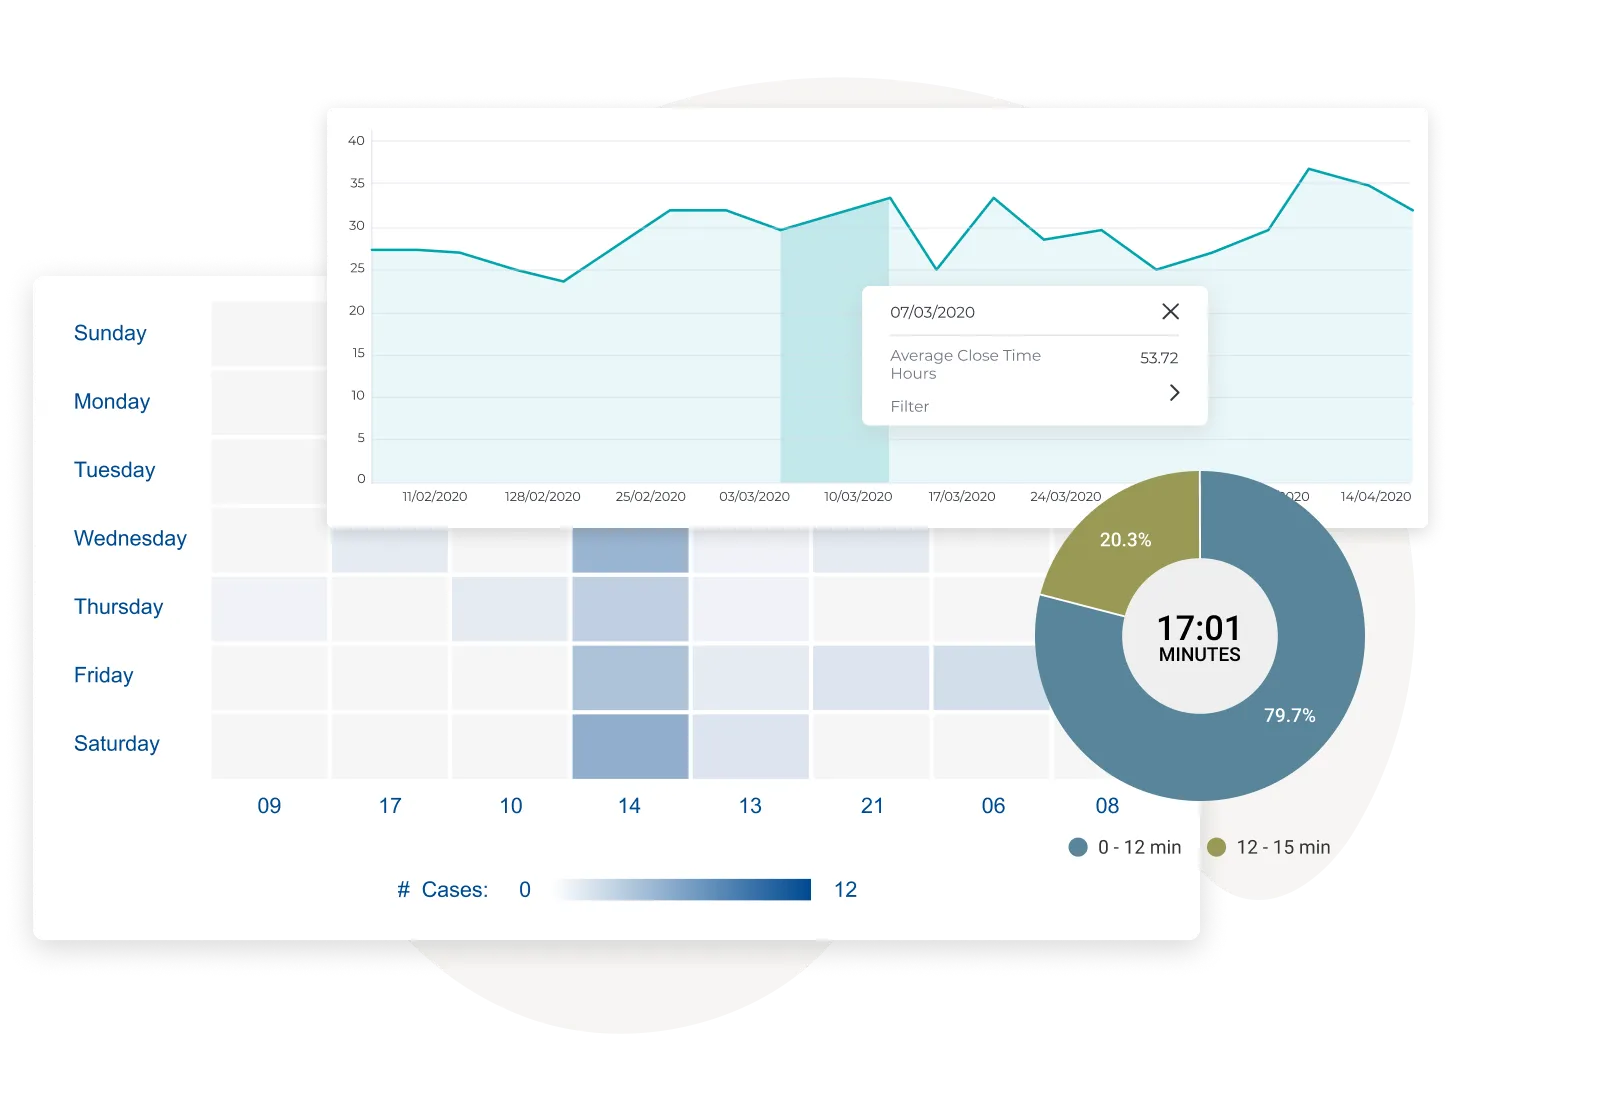
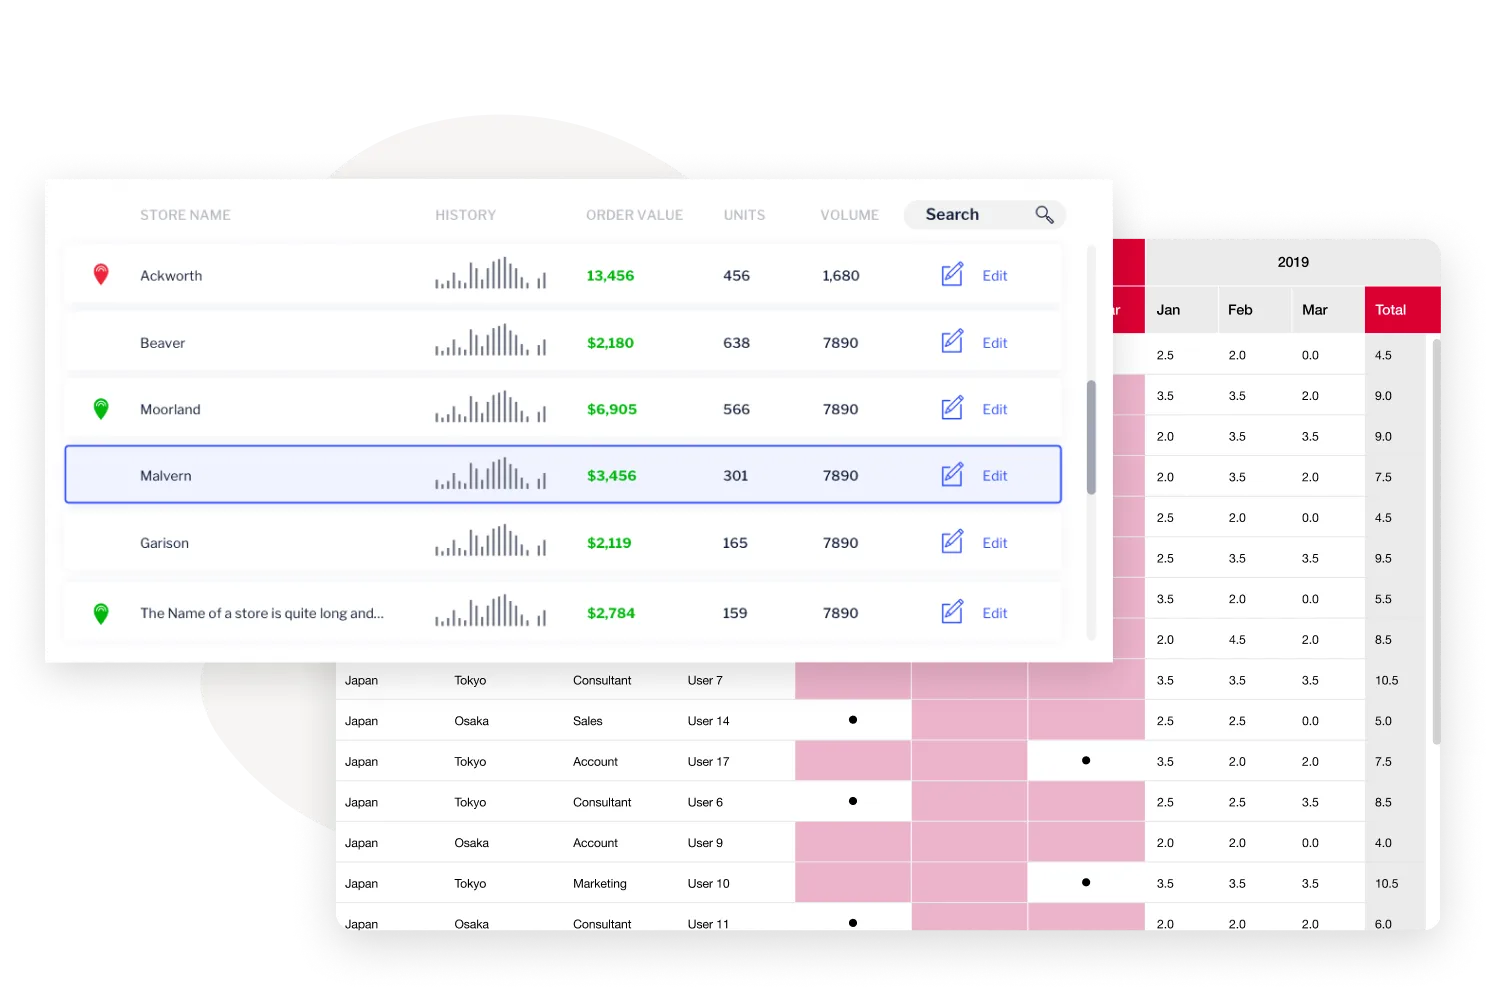
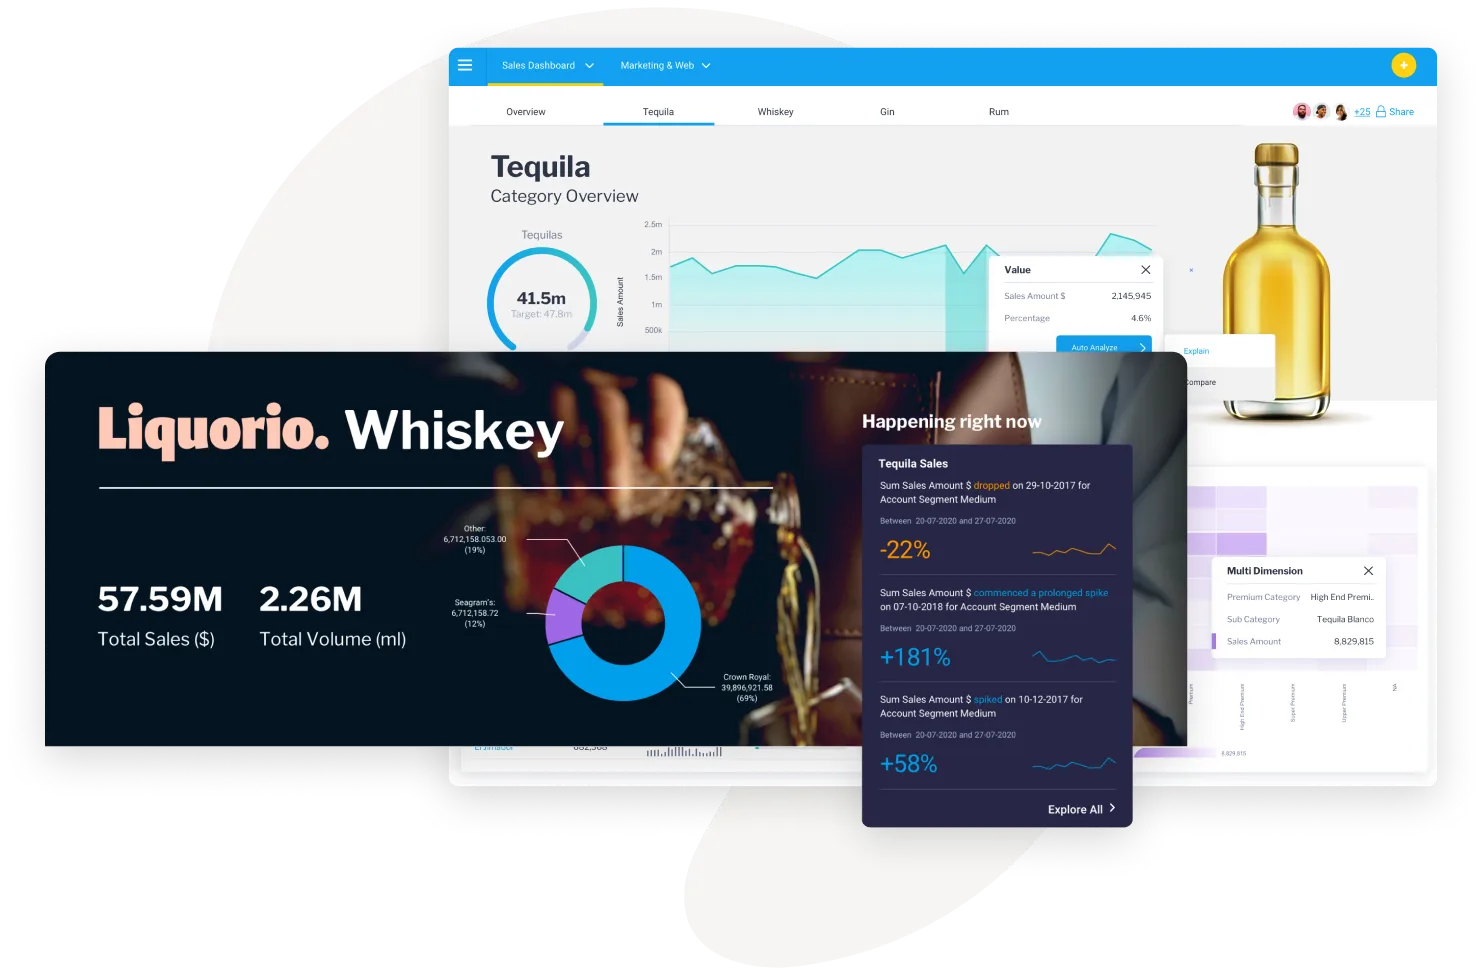
Yellowfin BI is a business intelligence software that provides robust data visualization capabilities. It allows users to transform complex data into visually appealing charts, tables, maps, and other interactive visualizations. This helps organizations make data-driven decisions by identifying trends, patterns, and insights more effectively.
Key Features
- Charts: Offers over 50 chart types, including bar charts, line charts, and trellis charts.
- Tables: Enhances tables with sparklines, bar formatters, and conditional formatting.
- JavaScript Charts: Supports custom visualizations using libraries like D3 and Highcharts.
- Maps: Integrates location intelligence with built-in mapping and Google Maps API.
- Text and Typography: Includes dynamic text options for better data storytelling.
- Shapes: Uses graphic components to highlight data insights.
- Canvas: Combines multiple visualization types into a single cohesive object.
- Guided NLQ: Facilitates advanced data queries through natural language.
Benefits
- Improved Decision-Making: Enhances understanding of complex data through visual insights.
- Easier Trend Analysis: Facilitates the identification of trends and patterns.
- Data-Driven Culture: Encourages a culture where decisions are based on data insights.
- Collaboration: Enables easy sharing and collaboration on data visualizations.