
A tool for creating various types of charts and visualizations from data, simplifying the process of data analysis and presentation.
Vendor
Airtable
Company Website

The Airtable Chart extension is designed to help users create various types of charts and visualizations from their data. It simplifies the process of data analysis and presentation by providing an intuitive interface for generating visual insights.
Key Features
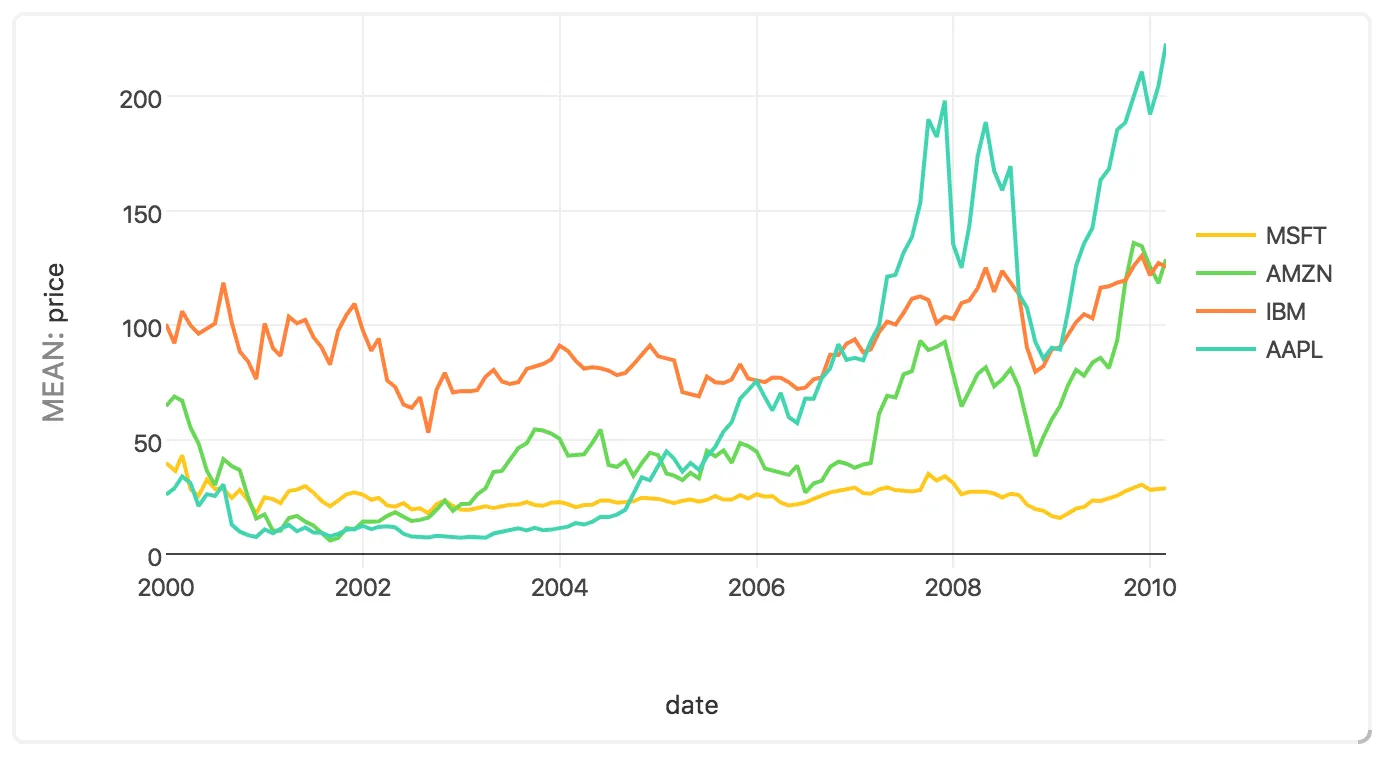
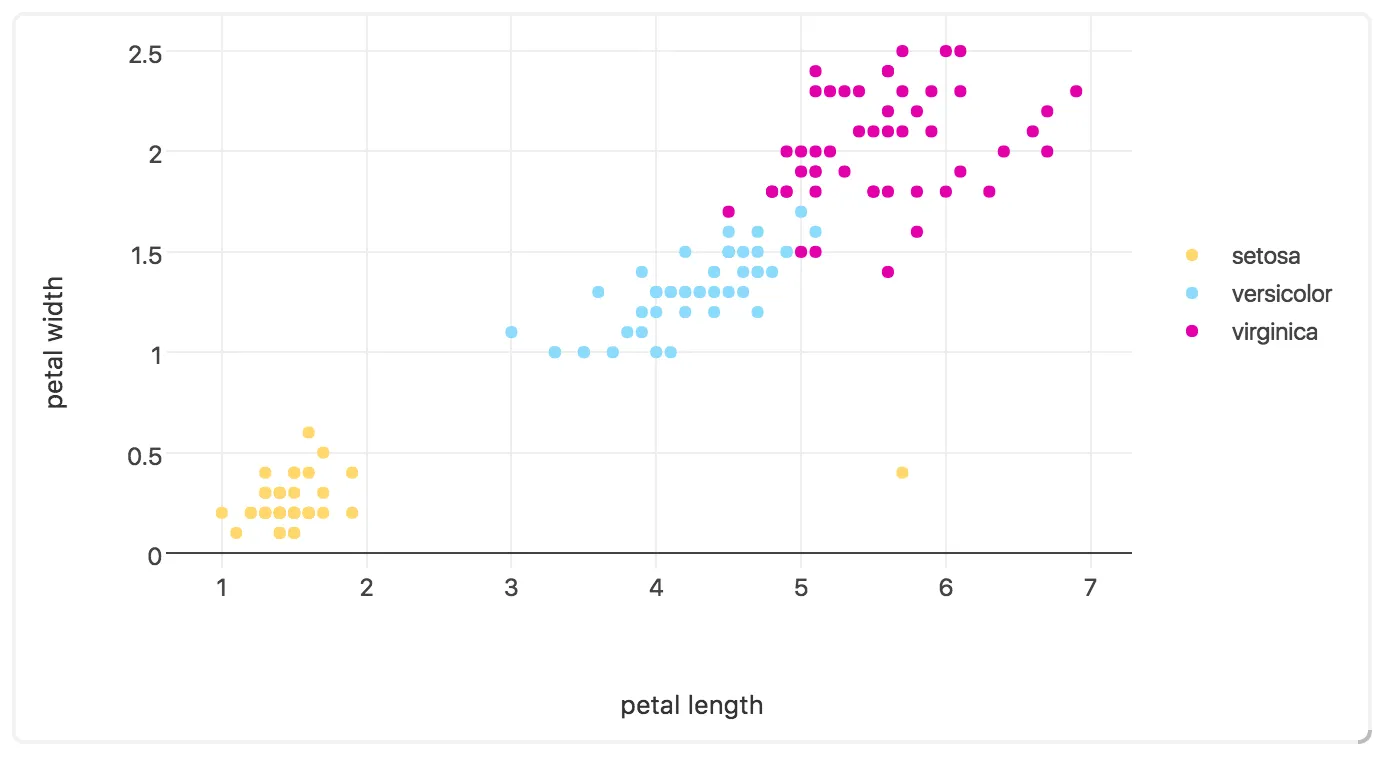
Multiple Chart Types Supports a variety of chart types including bar, line, scatter, pie, and donut charts.
- Choose the best chart type for your data.
- Customize charts to fit your specific needs.
Interactive Visualizations Create interactive charts that allow for dynamic data exploration.
- Enable features like zooming, panning, and tooltips.
- Interactive legends for better data understanding.
Easy Configuration Set up charts quickly with a user-friendly interface.
- Configure X and Y axes with various field types.
- Aggregate data for meaningful insights.
Benefits
Enhanced Data Understanding Visualize data to uncover trends and patterns.
- Make data more accessible and understandable.
- Facilitate better decision-making through visual insights.
Improved Presentation Create professional-looking charts for reports and presentations.
- Enhance the visual appeal of your data.
- Communicate insights effectively to stakeholders.