
ARMS provides full-stack performance monitoring and alerting and end-to-end tracing analysis. It monitors and analyzes user behavior and page performance in client environments such as browsers, mini programs, and mobile apps, to improve user experience.
Vendor
Alibaba Cloud
Company Website
Overview
ARMS provides full-stack performance monitoring and alerting and end-to-end tracing analysis. It monitors and analyzes user behavior and page performance in client environments such as browsers, mini programs, and mobile apps, to improve user experience. It monitors service calls, database queries, and system loads in distributed or microservices architectures and container-based or serverless deployment environments. With end-to-end tracing analysis, ARMS implements comprehensive monitoring and optimization for application performance.
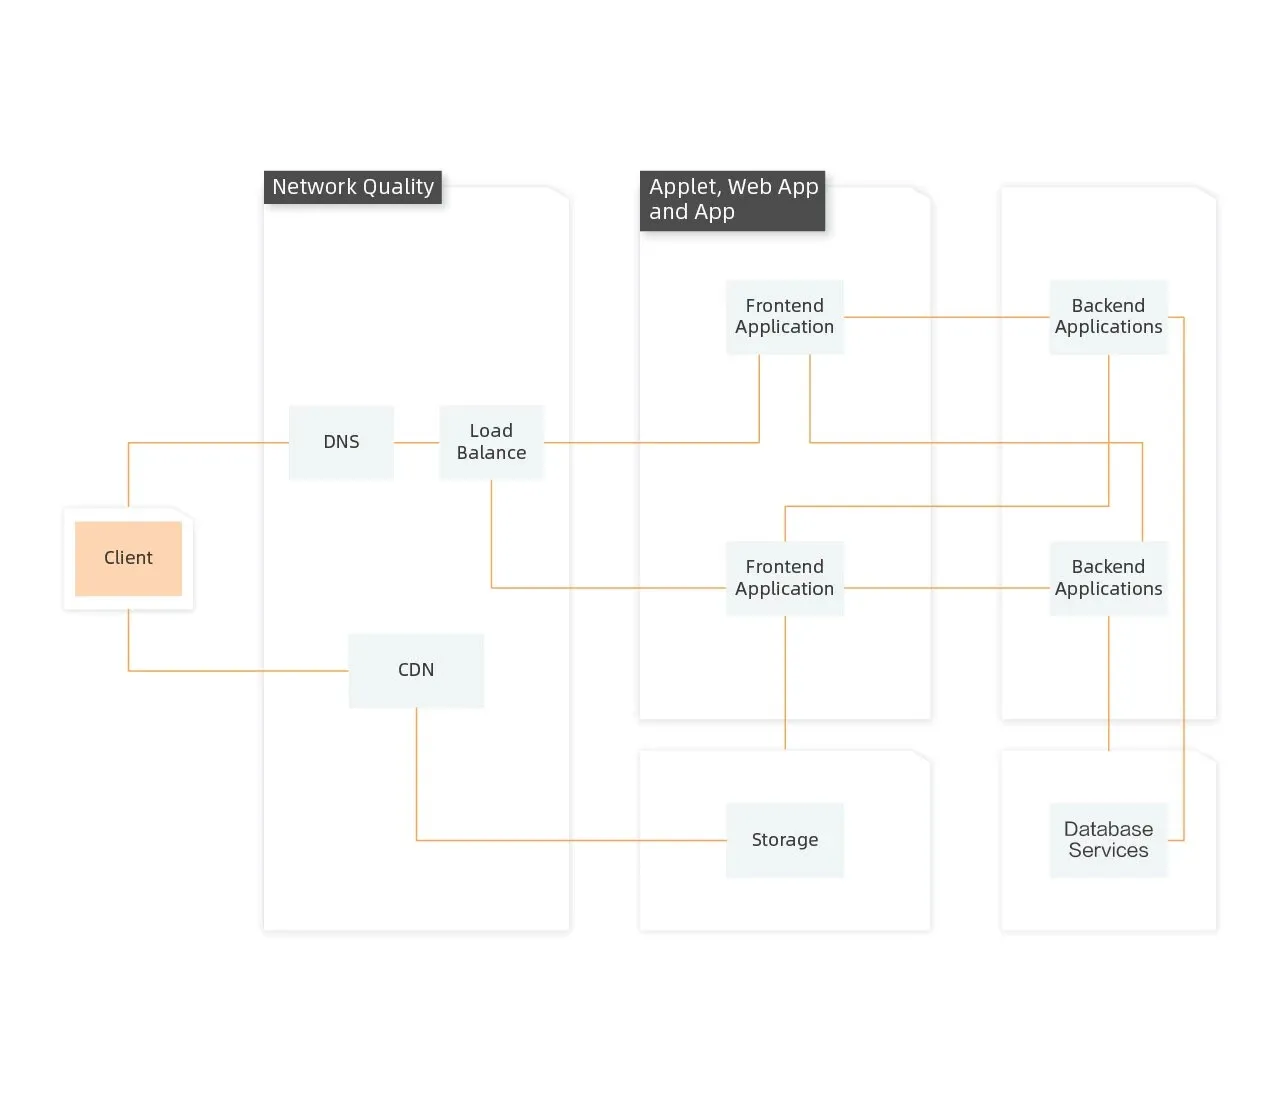
End-to-End Multi-scenario Coverage
Covers a wide range of monitoring scenarios such as network quality, web applications, mini programs, backend applications, containers, cloud services, and infrastructure.
Centralized Display and Analysis
Builds a centralized O&M and monitoring dashboard to provide multiple models for analyzing the root causes of bottlenecks.
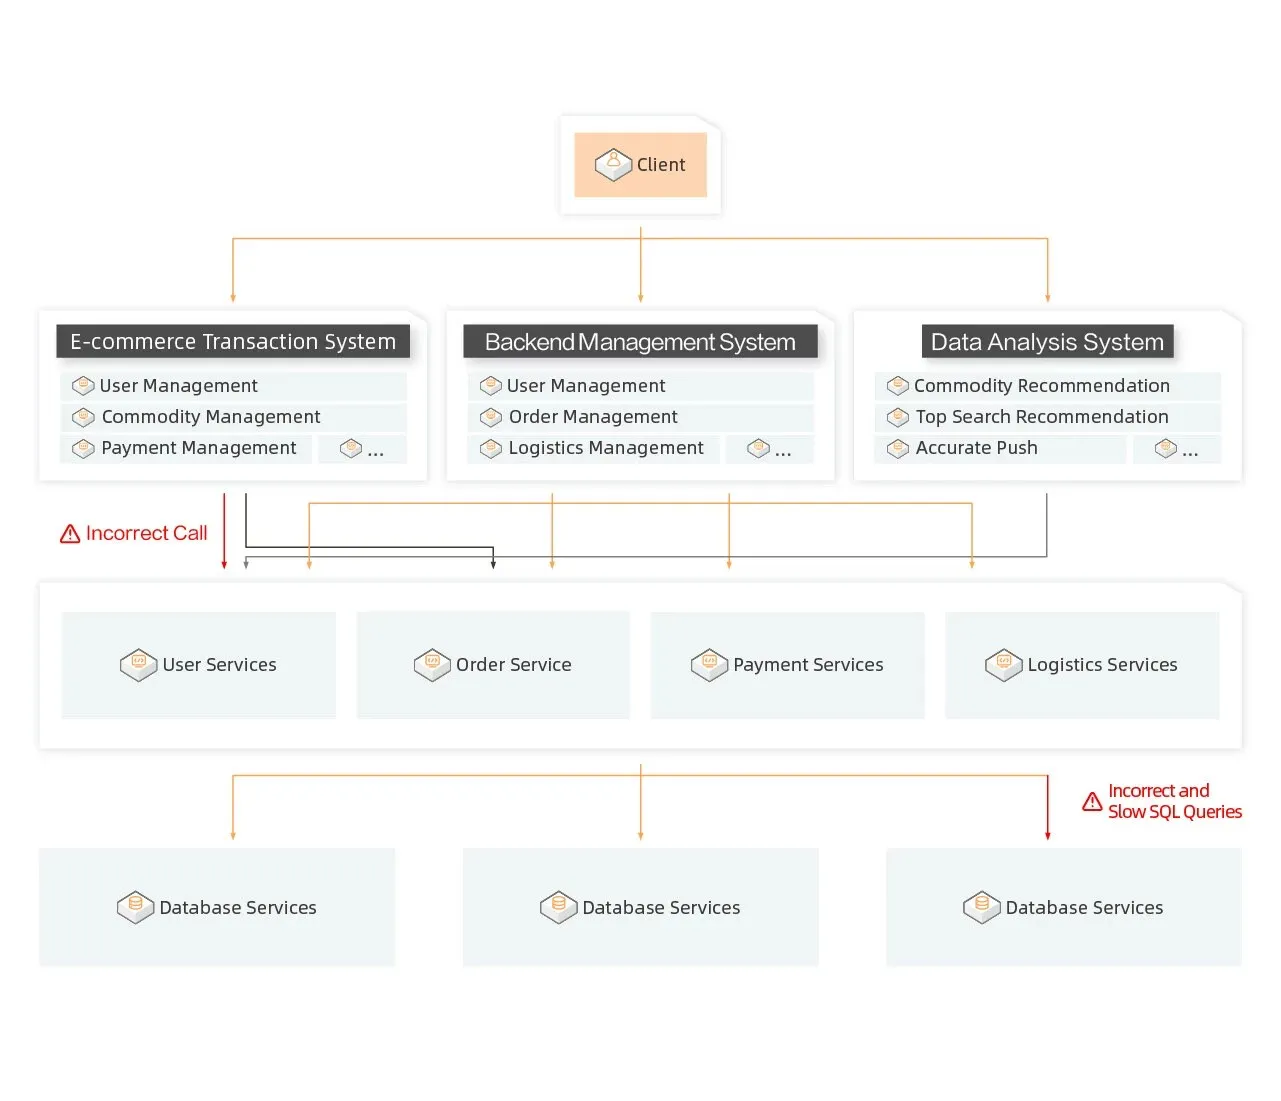
End-to-End Tracing Analysis
Supports end-to-end tracing based on full samples. This provides a basis for troubleshooting.
Centralized Alert Management
Builds a centralized alert management system for AI-enabled alert management and emergency coordination.
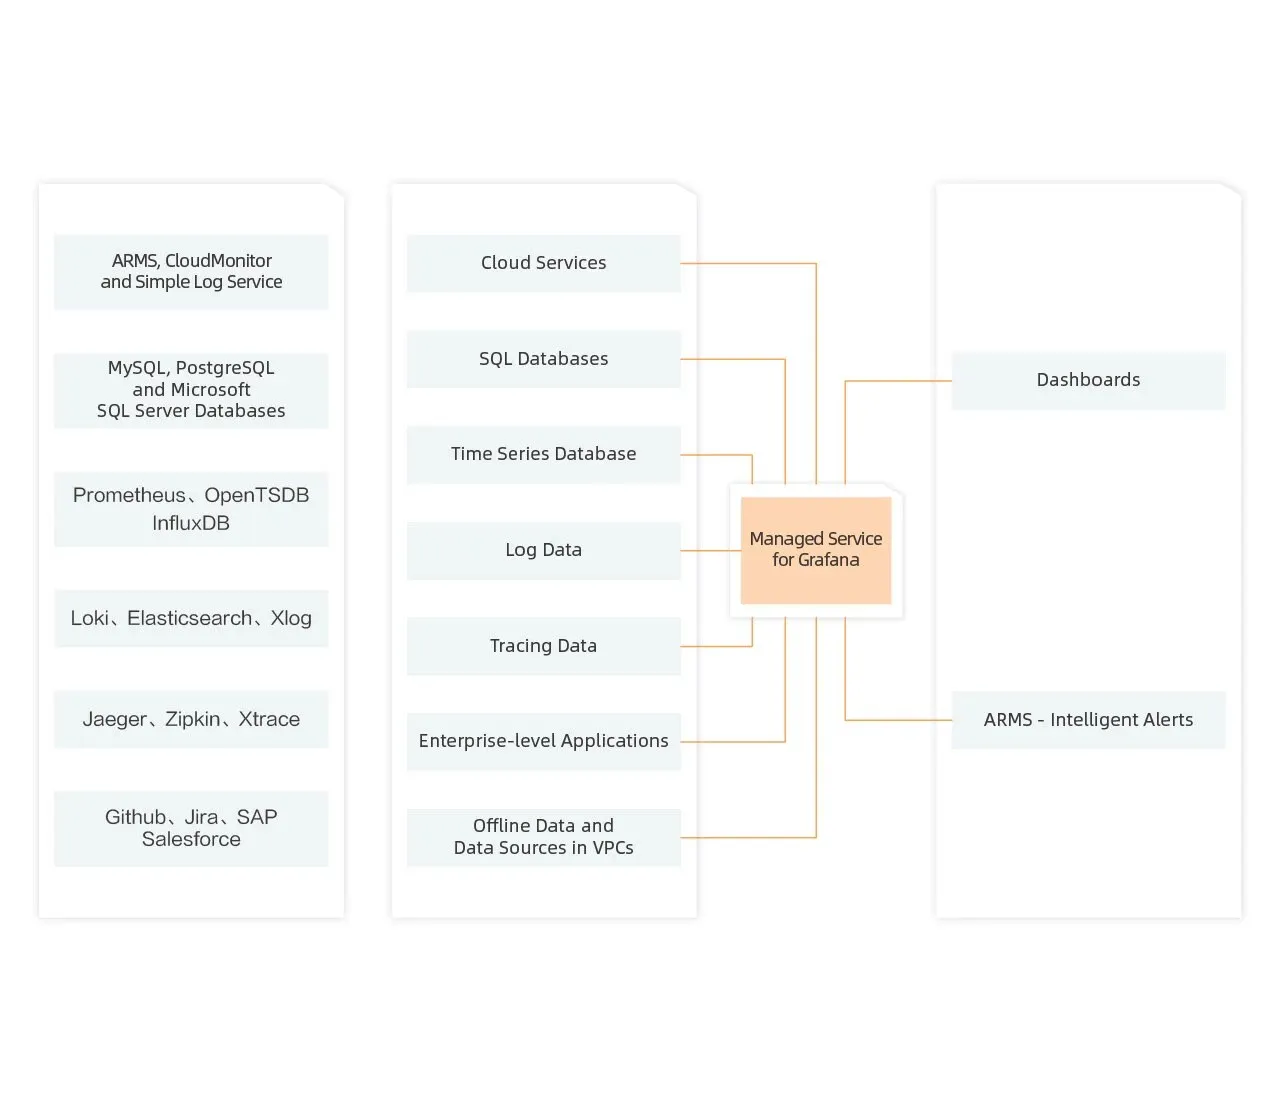
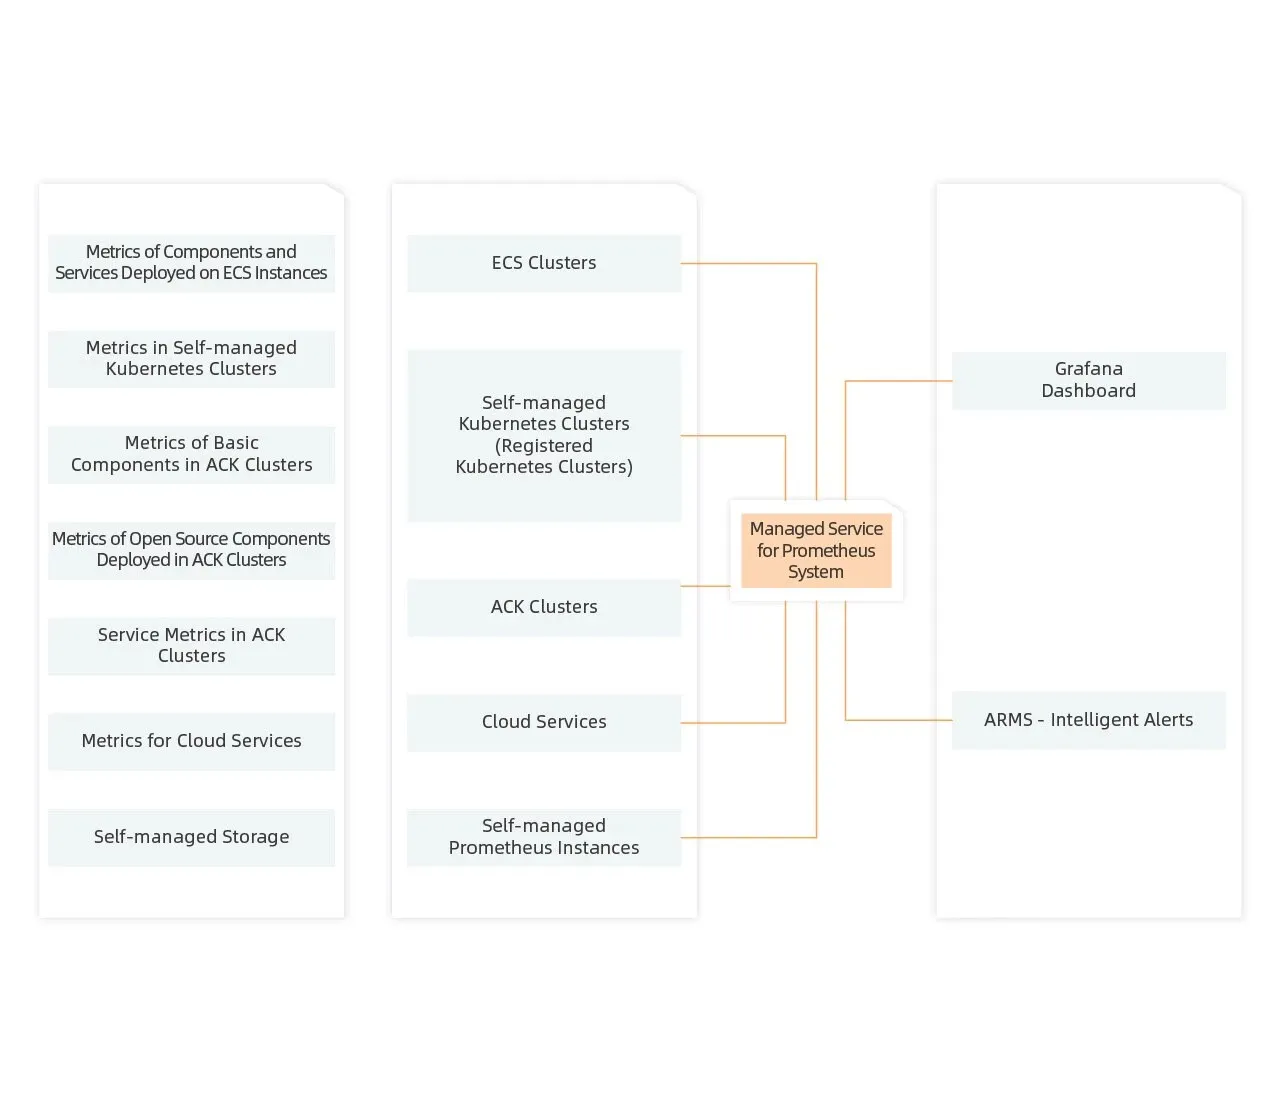
Open Source Support
Supports open source standards such as OpenTelemetry, Prometheus, and Grafana.
High Availability and Cost-efficiency
Provides low-consumption agents and a high-availability platform, and supports centralized billing by GB. This reduces monitoring costs.
Features
Browser Monitoring
Provides performance monitoring for web applications, mini programs, and mobile apps. Application Overview Provides an out-of-the-box application overview dashboard based on Grafana. The dashboard displays key metrics such as the number of sessions, page views (PVs) and unique visitors (UVs), access speed, JavaScript error rate, and crash rate of frontend applications in real time. Application Details Monitoring Provides monitoring dashboards for data exploration, session tracing, page or resource loading, and API request details. Application Diagnostics Provides JavaScript error diagnostics and crash or application not responding (ANR) analysis.
Synthetic Monitoring
Simulates the real users of multiple Internet service providers (ISPs) in different regions to monitor websites and APIs. Multiple Monitoring Types and Nodes Supports different monitoring types such as Elastic Compute Service (ECS) instances, PCs, and mobile clients, and has more than 200,000 user nodes worldwide, more than 500 monitoring points across IDCs owned by more than 400 ISPs, and hundreds of thousands of registered members. This way, the monitoring range can adapt to your business types and scale. Network Quality Diagnostics Automatically discovers distributed traces associated with monitoring requests in different monitoring scenarios by using tracing analysis. This way, the root causes of failed and slow requests can be accurately identified.
Application Monitoring
Provides performance monitoring and tracing analysis for Java applications. Application Details Monitoring Provides monitoring dashboards for Java virtual machines (JVMs), thread pools, pods, servers, and SQL calls. Trace Data Analysis Allows you to analyze the stored full trace data in real time based on filter conditions or aggregation dimensions. This way, the requirements for custom diagnostics in various scenarios can be met. Application Diagnostics Provides real-time diagnostics, Arthas diagnostics, exception analysis, and log analysis.
eBPF-based Application Monitoring
Provides eBPF-based non-intrusive multi-language application performance monitoring for Kubernetes clusters. Application Overview Displays all identified and integrated application services and their calls in a panoramic topology. Application Details Monitoring Provides dashboards and analysis for application topologies, dependent services, instance monitoring, trace data, and events.
Intelligent Alerting
Builds a centralized alert management system by aggregating multiple alert sources. Alert Overview Displays key alert metrics, alert statistics overview, and typical emergency response metrics. This way, you can monitor the health status of your business in real time. Alert Integration Provides abundant components for integrating cloud service providers and mainstream monitoring systems, and supports multiple notification methods such as text messages, phone calls, DingTalk, emails, and Fetion, as well as multiple collaboration tools such as Aone, Jira, and PagerDuty. Alert Collaboration Supports alert collaboration. ARMS supports multiple alert policies, such as notification, escalation, silence, and suppression policies. ARMS allows you to use GUI-based event processing flows to orchestrate procedures and process reported alert events. This meets your specific requirements for event handling in various scenarios. ARMS also supports full lifecycle management for alerts in an instant messaging (IM) tool or the console.